1. Adults with Autistic Spectrum Disorders (ASD)
1.1 Introduction
“Young people and adults with Autistic Spectrum Conditions (ASCs)
living in the London Borough of Wandsworth should be able to live
fulfilling and rewarding lives within a society that accepts and
understands them. People should be able to receive a diagnosis and any
support required. People with ASCs can depend on mainstream public
services to treat them fairly as individuals.” Wandsworth Market
Position Statement
Autism is defined as a lifelong developmental disability that affects
how people perceive the world and interact with others. Autism is
characterised by impaired social interaction and communication, severely
restricted interests and highly repetitive behaviours (see 1.2
diagnostic criteria for details). Autism can manifest in different ways
meaning people need different levels of support. Some autistic people
also have learning disabilities but autism itself is not a learning
disability. There is also a greater prevalence of some mental health and
physical health conditions amongst autistic people.
Terminology can vary and an autistic person might be described as
having:
- Autistic Spectrum Condition (ASC)
- Autistic Spectrum Disorder (ASD)
- Atypical autism
- Classic autism
- Kanner autism
- Pervasive developmental disorder
- High-functioning autism
- Asperger syndrome
- Pathological demand avoidance.
In this JSNA we use autism as a term that covers all these
diagnoses.
The evidence suggests that most self-advocates and groups of autistic
people prefer the term “ autistic person” to “person with autism” and
that is the wording that has been used in this chapter .
National strategy is governed by the Autism Act 2009 and the 2018
Think Autism Strategy Governance Refresh. The strategy has 19 objectives
under five headings:
- measuring, understanding and reporting the needs of autistic
people
- workforce development
- health, care and well-being
- specific support
- participation in the local community.
Children and young people with autistic spectrum disorders are
covered in the JSNA Start Well Chapter. There is an estimate of 1,530
adults with autism living in Wandsworth, nearly 1 in 100 of the adult
population.
This section of the JSNA looks at the barriers faced by autistic
adults in society and, where data is available, in Wandsworth in
particular. Most services focus on autistic children and young people.
However, autism is a lifelong condition and can have a significant
impact on adults. In addition, a significant number of autism diagnoses
take place in adulthood. Autistic adults with a diagnosis are entitled
to a Care Act Assessment but may not necessarily be eligible for
support. Wandsworth is in the process of developing a new local strategy
for autism that will cover all age groups.
It is important to remember autism can affect people differently. The
following sections are a generalisation and not all statements will
apply to each autistic person.
Autism is unique in being the only condition that has its own Act,
but there is no requirement to provide statutory social care services
for autistic people.
Autistic people are more likely to be:
- unemployed or under-employed
- socially isolated
- at greater risk of some physical and mental health conditions
- vulnerable to suicide
- undiagnosed, particularly if they are women, BAME or older
people
- communication impaired
- hypo or hyper-sensitive to sensory stimuli
- bullied, victims of hate crimes and exploitation
- in the Criminal Justice System.
1.2 Diagnostic Criteria
Diagnosis is the formal identification of autism, usually by a
Multidisciplinary Diagnostic Team (MDT). Although autism is a lifelong
condition and often diagnosed in childhood, there are significant
numbers of adult diagnoses. Nationally, between April to December 2018,
5,255 adults were referred for assessment where their need was suspected
autism .
Although autism is different in every person, for a diagnosis to be
made a person will usually have:
- Persistent difficulties with communication and social
interaction
- Restricted and repetitive patterns of behaviours, activities or
interests, that limit and impair everyday functioning.
Tools used for a formal diagnosis of autism vary and include:
- Diagnostic Interview for Social and Communication Disorders
(DISCO)
- Autism Diagnostic Interview – Revised (ADI-R)
- Autism Diagnostic Observation Schedule (ADOS)
- Developmental, Dimensional and Diagnostic Interview (3Di).
1.3 Comorbidities
Some conditions are commonly diagnosed alongside autism. These
include Attention Deficit Hyperactivity Disorder (ADHD) and Pathological
Demand Avoidance (PDA). While these are starting to be seen as potential
characteristics of autism, PDA is also seen as a diagnosis in
neurotypical people.
A learning disability is defined as a reduced intellectual ability
and difficulty with everyday activities (for example,
household tasks, socialising or managing money) which affects someone
for their whole life. Research into the overlap between autism and
learning disabilities varies in the estimation of the proportion of
autistic people who also have a learning disability. Most studies show
between 44% and 52% of autistic people may have a learning disability
and between 31% and 36% of people with a learning disability may also be
autistic .
Some physical health conditions are more prevalent amongst autistic
adults than in neurotypical adults. These include :
- immune disorders such as allergies and asthma
- metabolic disorders such as diabetes
- heart disease
- motor disorders such as cerebral palsy.
Some autistic people may avoid going to a doctor due to stress, fear
of change (especially with unfamiliar doctors) and worry about
procedures such as colonoscopies. This means diagnosis and treatment of
other conditions can be delayed which can have a long-term physical
health impact.
Studies have also found that gastrointestinal disorders are more
common amongst children with autism than the neurotypical population,
and up to a third of autistic people may experience epileptic seizures
compared to 1-2% of the neurotypical population .
Amongst autistic children, an estimated 30-60% are also diagnosed
with attention deficit disorder (ADD) or attention deficit hyperactivity
disorder (ADHD), compared to 6-7% of neurotypical children. Autism can
disrupt sleep for children and adults .
Some Common Mental Disorders (CMD) can be prominent amongst autistic
people. 40% of autistic people have symptoms of at least one anxiety
disorder compared to 15% of the neurotypical population. This is often
combined with depression. A combination of factors that lead to
vulnerability to stress include:
- biological differences in brain structure
- history of social difficulties including decreased self-esteem and
an overestimation of threats
- problems finding flexible responses to change and apparent
threats.
Obsessive Compulsive Disorder (OCD) is also more common in autistic
people. This is thought to be because of a combination of genetic
factors and psychological predisposition. Diagnosis of OCD in autistic
people is difficult because it may be mistaken for repetitive
behaviour.
It is estimated 20% of the population will experience a period of
depression in their lifetime, this is more common in autistic people.
They can also find it harder to seek help for depression because change
can be daunting and raise anxiety levels. It can be difficult for them
to explain their feelings, symptoms, and concerns.
1.3 Prevalence and the Level of Need in the Population
There are around 700,000 people with autism in the UK, more than 1 in
every 100 of the population.
The Adult Psychiatric Morbidity Survey (APMS) included a measure for
autism for the first time in 2007. It showed 1% of the adult population
had autism (decreasing by age from 1.1% aged 16-44 to 0.8% aged 75+).
The Department of Health funded a project to build on this study and
found that the actual prevalence was closer to 1.1% of the population.
The APMS carried out in 2014 showed a prevalence of between 0.5% and
1.3% of the population – the large range is due to the low prevalence
combined with the size of the sample.
There is no register of adults with autism. However, in Wandsworth
there are 737 children with a diagnosis of autism known to schools,
approximately 1.65% of the population. This is higher than the London
average of 1.5%, and England average of 1.37%. The lower prevalence in
adults found in the APMS is probably due to:
- an increase in diagnosis over time, either due to an increased
prevalence of the condition or better diagnostic criteria now compared
to the 1970s and 80s
- lower life expectancy for autistic people.
Using age-related national prevalence rates based on a total national
population of 1%, it is estimated that the number of people in
Wandsworth with autism in 2020 is approximately 2,700, 1.02% of
Wandsworth’s population. The table below assumes that the percentage of
the population with autism remains steady.
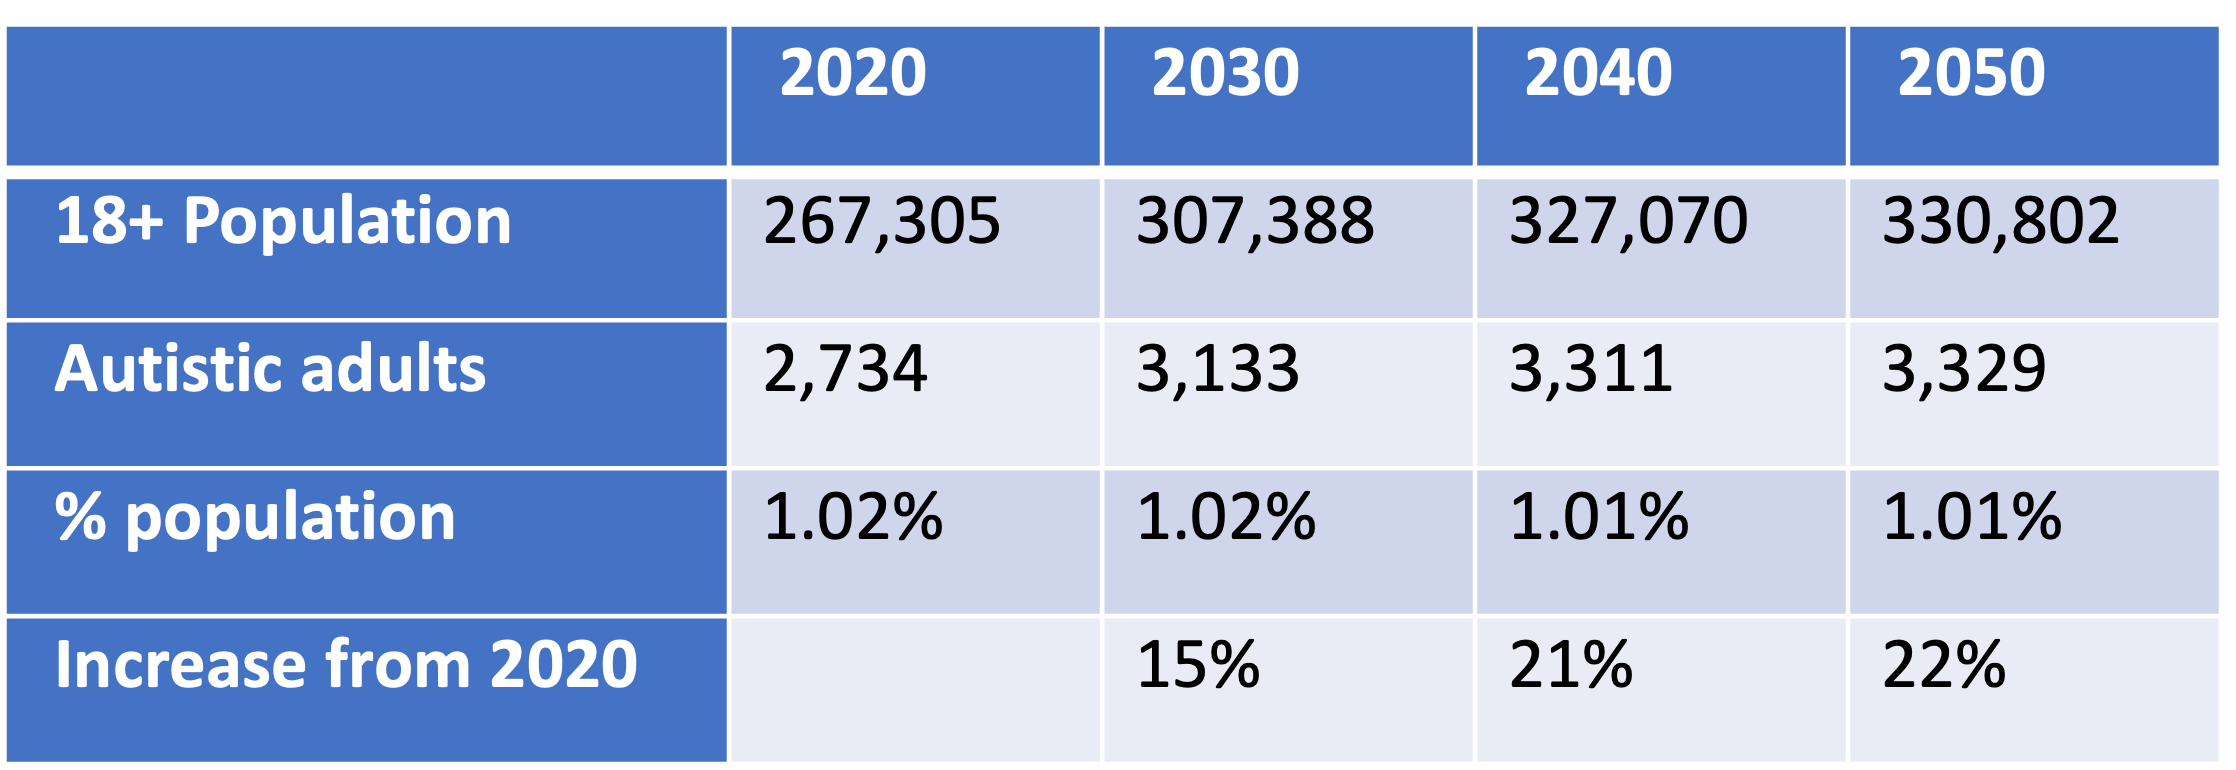
Estimated number of autistic people in
Wandsworth
Source: GLA population estimates & Office of National Statistics
(2016)
Most new diagnoses of autism occur in children. However, because of
improved diagnostic criteria and an increase in awareness, more adults
are being diagnosed. Nationally 17,975 new referrals for
suspected autism were made between April and December 2018. 70% of these
were children and 5,255 were adults. If this rate is consistent it would
suggest that nationally, approximately 7,000 adults will be referred for
a new autism diagnosis. 64% of all referrals were men and boys. (The
data does not show how many people received a diagnosis).
Autism is not regarded as a social care need. However, there are some
people with a social care need who also have autism. In 2017-18, there
were 87 new assessments in Wandsworth Adult Social Care for autistic
people:
- 52 had a learning disability
- 15 had a mental health need.
1.4 Current Services
While providing a social care assessment is a statutory requirement,
unless autistic people have other needs such as learning disabilities,
it is unlikely that they will be eligible for statutory social care
support. Most support services designed for autistic people are
non-statutory. In Wandsworth, work is underway as part of the refresh of
the Autism Strategy, to review services and develop actions to improve
the experience of autistic people in accessing local autism
services.
The Wandsworth Autism Advisory Service (WAAS) is a multi-professional
team that supports schools, organisations and families in Wandsworth to
achieve the best possible outcomes for autistic children and young
people. The service supports education establishments to enable all
children with autism and social communication disorders to achieve their
full potential.
WAAS offers a service which is available to all Wandsworth residents
with a child or young person with a diagnosis of autism, Wandsworth
schools, early years settings, services and professionals. The service
also provides a more specialist and targeted offer which is accessed
through referral to the service.
The WAAS works closely with partners across Wandsworth to provide a
planned and graduated support for parents and families who have a child
with autism (and those on the specialist pathway). The service provides
a point of contact for specialist advice and support. It aims to
up-skill families through a bespoke parent / carer training programme.
Parent support is available to all Wandsworth residents regardless of
the child/ young person’s educational placement. Up to date details of
the parent offer can be found on the Wandsworth Local Offer.
Choice Support is commissioned by the Council to provide employment
support for autistic people, with or without a learning disability. The
service includes support in obtaining and maintaining employment,
working both with the individual and their employer.
The National Autistic Society provides support and guidance for
adults and children with autism, and their families. Their “Autism at
Work” service works with employers to support autistic people in the
workplace .
1.5 Predictive Factors
Autism is a lifelong condition that affects 1.1% of the population .
Despite this relatively high prevalence, the causes are still largely
unknown. Factors that can increase the likelihood of a diagnosis of
autism include:
- an autistic sibling
- older parents
- certain genetic conditions
- very low birth weight
- some maternal metabolic conditions.
It is probable there are genetic factors responsible for some forms
of autism. It is more likely to have multiple genes and an interaction
with environmental factors rather than a single genetic cause.
Identifying a predisposition to autism through genetic testing is,
therefore, not possible .
1.6 Related Effects of Autism
Autism and communication Autistic people have difficulties with
interpreting both verbal and non-verbal language. They may find it
particularly difficult to understand:
- facial expressions
- tone of voice
- jokes and sarcasm.
Some autistic people may not speak or may have limited speech. They
will often understand more of what is said to them than they are able to
express and may struggle with abstract concepts. Some autistic people
benefit from using sign language or visual symbols instead of speech.
Others may have good language skills but struggle to understand the
expectation of others within conversations. This can manifest itself in
a number of ways including repeating what the other person has said or
talking at length about their own interests .
Sometimes a diagnosis of auditory processing disorder can occur
alongside autism. This condition impairs the ability of the person to
understand what they hear and convert it into meaning. This condition
can also occur separately to autism, there is currently no definitive
understanding of how the two conditions are linked .
Eye contact can be hard for some autistic people to the point of
causing physical pain if forced. This can often make normal social
interactions difficult .
Autistic people can find it hard to decode everyday speech,
especially when the person talking is using sarcasm, “kind lies” or
“half-truths”. This inability to see subtext in a conversation can make
autistic people vulnerable to exploitation, especially when friendship
is being offered .
Masking is a behaviour where autistic people will try to imitate
neurotypical behaviour in order to avoid social stigma. However, this
can cause autistic people intense strain which can make coping harder .
“Information overload” is a familiar term when talking about email
communications and social media. However, autistic people will often
experience this in everyday life. If there is too much information
(including sensory information) some autistic people can be distressed
and shut down, unable to interact further. Some autistic people can use
“pre-intentional” communication, talking to themselves to help them keep
calm and focussed, or as a reaction to an exciting or distressing
situation .
These communication difficulties mean that many autistic people
can:
- appear to be insensitive
- seek out time alone when overloaded
- fail to seek comfort, help or support from other people
- appear to behave strangely or inappropriately
- become physically or verbally aggressive towards themselves or
others when overwhelmed
- retreat into themselves and be unresponsive.
Failure to recognise the communication needs of autistic people can
exacerbate the communication barrier and lead to autistic people
shutting down or being labelled as having challenging behaviour.
Sensory Differences
Some autistic people process sensory information differently to
neurotypical people. This can vary from person to person, from sense to
sense, and be either over or under sensitive to different inputs . For
example:
- an oversensitivity to touch might cause someone to feel a seam in an
article of clothing as not only uncomfortable but giving them
overwhelming pain
- an under-sensitivity to sound may mean that someone is unable to
even recognise someone talking to them without extreme effort to
concentrate. However, an oversensitivity to sound may mean that someone
is overwhelmed and unable to function because of a background noise
which a neurotypical person may not even notice.
Sometimes sensory differences means autistic people might be obsessed
with certain patterns, shapes, colours, sounds and sensations. This can
lead to compulsively touching people and objects or making obsessive
sounds.
This over and under sensitivity to sensory input can manifest in all
or just some of the senses, each person will be affected
differently.
Autism and Patterns of Behaviour
Autistic people can find the world confusing and overwhelming. Often,
they prefer a regular daily routine so that they know what is going to
happen, and a set of rules that they can follow without variation. They
can find changes upsetting, especially if they are unexpected .
Many autistic people have intense or highly focussed interests. These
can change and develop over time but tend to be lifelong. This can often
be channelled into studying, work, volunteering or other meaningful
occupation, and can be fundamental to their well-being.
Some autistic people will use self-stimulating repetitive behaviours
such as fiddling with an object or rocking . This is thought to be a way
of imposing some control over intense emotions and thoughts.
Autism and Life Expectancy
A Swedish Study Hirvikoski (2018) showed the average
age of death for an autistic person is 58 years for those without a
learning disability and 39.5 years for those with a learning disability,
compared with an age standardised general population age of 70. Leading
causes of death were found to be neurological disorders such as epilepsy
(which has previously been linked to autism) and suicide. People with
high-functioning disorders have a nine-fold suicide risk compared to the
neurotypical population.
An American Study in 2017 found the life expectancy for autistic
people to be 36 years old compared to 72 years for the general
population. It found 28% died due to an injury including suffocation,
asphyxiation and drowning. This study looked primarily at
lower-functioning disorders.
Autism and Employment
There is a significant employment gap for autistic people when all
disabilities are considered :
- 80% of people are in full or part time paid employment
- 47% of people with disabilities are in full or part time paid
employment
- 32% of autistic people are in full or part time paid
employment.
Only 16% of autistic adults are in full-time paid employment. This
figure has remained steady since 2007. In addition, 77% of those who are
not employed say that they would like a job, and 25% of those employed
part time would like to work more hours. 51% of autistic people in
employment reported that they had skill levels higher than their job
requires .
When autistic people are in work, 48% have experienced bullying or
harassment in their workplace. Only 58% have disclosed their autism.
Where people have disclosed their autism, only 32% were asked what
adjustments they would need in the workplace .
Barriers to employment for autistic people include :
- The interview and application process: One of the defining
characteristics of autism is communication difficulties. An autistic
person might need more time to formulate their answers to interview
questions, or may have difficulties coping with the interview
process
- The work environment: Since many autistic people have sensory
sensitivities, a work environment that is noisy, brightly lit or busy
can be overwhelming. 35% of people who had disclosed their autism to
employers said that the adjustments made were poor
- Lack of employer understanding about autism: 60% of employers stated
that they do not know where to go for support or advice about employees
with autism, 60% said they would worry about getting the support they
offered to an employee wrong, and 40% believed it would cost them more
to employ someone with autism.
Autism and Social Isolation
The Adult Psychiatric Morbidity Survey in 2007 showed the
prevalence of autism was higher amongst single respondents than married
people. Research in America has shown that only 5% of autistic adults
marry and 67% have no interest in romantic relationships. While the
participants for this study were more likely to be on the lower
functioning end of the spectrum (most of the participants were diagnosed
in the 1970s/80s when the criteria was stricter), the results do suggest
that autistic adults are less likely to form romantic relationships.
Many autistic people find it hard to form friendships, even when they
want to. Understanding and communicating with other people is
particularly difficult and can leave autistic people feeling lonely. As
many as 79% of autistic people, and 70% of their families, feel socially
isolated. 81% say they feel lonely some of the time because of autism
related anxiety rel. 81% of young autistic people believe they spend
less time socialising than their peers .
Some of the factors that impact on social isolation include :
- struggles in social situations
- autism as a hidden disability and can be misunderstood by people
around them
- prevalence for anxiety and depression can cause loneliness and
social isolation
- the employment gap for those with autism limits the opportunities to
make connections with other people
- 70% of autistic adults feel that they need more support to reduce
social isolation.
Transition
At ages 16-25 young autistic people have challenges due to the impact
of sudden change in their lives. Change may include:
- moving from a structured school environment to more self-directed
learning, employment or unemployment
- adjusting to changing friendship groups and building adult
relationships
- changes in or lack of support.
Criminal Justice System
Not only are autistic people vulnerable to exploitation, bullying and
hate crime, there is evidence autistic people are overrepresented in the
Criminal Justice System. This is thought to be due to :
- susceptibility to influence, exploitation and manipulation
- inability to think beyond the immediate impact of an action
- difficulties expressing thoughts and emotions leading to a physical
response to frustration.
Autism and Gender
More men are diagnosed with autism than women. The condition can
often manifest itself in different ways by gender. Various studies have
shown the ratio of male to female autistic people varies significantly.
A 2009 survey of adults living in households throughout England found
that 1.8% of men and boys had an autism diagnosis compared to 0.2% of
women and girls. A 2017 study showed a male to female ratio of
approximately 3:1. A study of people with a learning disability and
autism showed a ratio closer to 2:1 .
The male and female ratio has been challenged and there are a number
of theories to explain the gender differences. These include :
- girls and women with autism have characteristics that do not fit the
profile usually associated with men and boys (diagnostic tools are based
on characteristics found in groups of males)
- bias from practitioners who see autism as primarily a male
condition
- autism is an exaggeration of normal gender differences
- the effects of foetal testosterone on brain development are a causal
factor in autism
- a range of biological factors may mean men and boys have a higher
prevalence
- women and girls on the higher-functioning end of the autistic
spectrum may be better at masking their traits
- autism traits in girls are underreported in schools.
Autism Diagnosis Post-childhood
While autism diagnosis in children has improved, there have also been
more adult diagnoses in recent years. Current knowledge of older people
and autism is limited. Under-diagnosis may lead to a lack of support for
managing the impact of their condition such as social isolation at home,
or in accommodation-based care .
The lower life expectancy for adults with autism distort prevalence
rates. Autistic people without a diagnosis and the corresponding
support, are at a higher risk of life reducing mental health
conditions.
1.8 Diagnosis and Identification
Estimated numbers of autistic people in the population are subject to
a large margin of error. Studies to determine population prevalence give
varied results dependent on the criteria used. Diagnostic criteria has
evolved as a greater understanding of autism has been developed. While
increasing numbers of people are diagnosed in childhood, there are still
several autistic people who receive a diagnosis in adulthood or who have
not been diagnosed and are unable to access appropriate support
services. Current knowledge of older people and autism is limited .
There are two suspected under diagnosed groups:
- Women and Girls: More men are diagnosed with autism than women and
the condition can often manifest itself in different ways by gender.
There are a number of theories to explain the gender split but there is
no conclusive evidence the split is due to genetic factors (i.e., men
more likely to be autistic), or social and diagnostic factors (i.e.,
women less likely to be diagnosed)
- BAME Groups: Evidence suggests BAME children and adults can
experience difficulties with obtaining a diagnosis of autism, and more
likely to be diagnosed incorrectly with other conditions .
Services and Support
Autistic people experience many barriers to day-to-day living, and
because autism is a hidden disability these are not always known,
understood or acknowledged.
Communication difficulties mean that many autistic people can:
- appear to be insensitive
- seek out time alone when overloaded
- fail to seek comfort, help or support from other people
- appear to behave strangely or inappropriately
- become physically or verbally aggressive towards themselves or
others when overwhelmed
- retreat into themselves and be unresponsive.
Many autistic people react negatively to change. They prefer a
regular daily routine so that they know what is going to happen, and a
set of rules that they can follow without variation. Unexpected changes
can be debilitating, and they take more time to adapt to the new
situation.
There is a significant employment gap for autistic people, more than
when all disabilities are considered. Only 16% of autistic adults are in
full-time paid employment, 32% are in paid employment.
Many autistic people find it hard to form friendships, autistic
adults are less likely to form romantic relationships. As many as 79% of
autistic people and 70% of their families feel socially isolated.
Health
Some physical health conditions are more prevalent amongst autistic
adults than in neurotypical adults . These include:
- immune disorders such as allergies and asthma
- metabolic disorders such as diabetes
- heart disease
- motor disorders such as cerebral palsy.
Some Common Mental Disorders (CMD) are also more prevalent amongst
autistic adults:
- 40% of autistic people have symptoms of at least one anxiety
disorder compared with 15% of the neurotypical population
- Obsessive Compulsive Disorder (OCD) is more common in autistic
people
- depression is often linked with anxiety.
Some people with may avoid going to a doctor due to stress, fear of
change, and worry about procedures. They can also find it harder to seek
help for CMD because change can be daunting and raise anxiety levels.
They can also find it difficult to describe their feelings, making it
hard to communicate symptoms and concerns.
Studies show people with high-functioning disorders have a nine-fold
suicide risk compared to the neurotypical population. It is a leading
cause of the reduced life expectancy for autistic people.
1.9 Interventions/Approaches According to the Evidence Base
Several weaknesses that have been identified with the current
evidence base for the support needs autistic adults. This is partly due
to the lack of services specifically for adults as they are often not
eligible for social care support. If they have another condition, such
as a learning disability or mental health condition, care is focused on
that condition.
The National Institute for Clinical Evidence guidelines recommend
psychosocial interventions rather than medication. There has been no
convincing evidence that medication is effective in managing autism .
Applied behaviour analysis, although a common treatment, has been
heavily criticised because it seeks to impose neurotypical behaviours on
autistic people. A strength-based approach has been shown to be more
effective because it works with the positives autism brings to people’s
lives, especially their individual strengths.
A good understanding of autism is required to design and deliver
support services tailored to individual need. This can be a challenge
because people have a variety of characteristics. Autism training for
front-line staff has been found to have a positive impact on people’s
experience of services and autism friendly environments.
Research has found social skills training may be effective for in the
reduction of depression, anxiety and inappropriate social behaviour.
However most existing training is aimed at young adults and it is
unknown whether the value for adults aged 30+ would be the same .
Services that provide general support for independent living have
proven successful. Peer support groups are another valued service and
provide autistic people opportunities for social interaction and sharing
experiences.
A multidisciplinary approach can reduce service costs, increase
diagnosis rates, reduce crisis interventions, and improve employment
rates.
2. Physical and Sensory Disabilities
2.1 Introduction
Physical and sensory impairments affect people across all ages of the
life course. Impairments can be caused by a condition, injury or the
result of ageing. Some may present from birth or can be sustained after
a life-changing event. These impairments can be a great challenge for
those in a world designed for able-bodied people. Depending on the
impairment, a person may have issues with transport, access, and
communication. The government has prioritised all disabilities through
the Equality Act 2010 . However, further progress is required to
improves the lives of disabled people:
“All people should have the opportunity to be active citizens; live a
meaningful life and make positive contributions to the community they
are part of. People with a Physical or Sensory Impairment have the same
aspirations as everyone else. They would like to be independent, have a
job, have their own home, make and keep friends, form relationships and
choose what they do in their spare time. People with physical and
sensory disabilities should be recognised as equal and enjoy the same
life opportunities as others. We want services in our Borough that
actively work with people to define their goals and achieve them;
services that consider the whole of a person’s life and to work with
providers that are aware of varied areas of provision and make links
across the care landscape.”
Wandsworth Market Position Statement
Defining disability is complex and contentious. The ‘social model of
disability’ states people with disabilities encounter barriers in
society including the environment, people’s attitudes and organisations.
The ‘medical model’ is based on a belief that disability is caused by an
individual’s health condition or impairment .
Examples of definitions include:
- The Equality Act 2010 defines disability as having a physical or
mental impairment that has a substantial and long-term negative effect
on the ability to do normal daily activities. Long-term is defined in
the guidance in terms of at least 12 months
- The World Health Organisation states that a disability “is an
umbrella term, covering impairments, activity limitations, and
participation restrictions. An impairment is a problem in body function
or structure; an activity limitation is a difficulty encountered by an
individual in executing a task or action; while a participation
restriction is a problem experienced by an individual in involvement in
life situations.”
For the purposes of this chapter, we are defining physical and
sensory disabilities as “a physical, mobility or sensory condition that
causes a person to face barriers in undertaking day to day tasks”. This
fits with the national reporting model for social care which groups
people by their primary support reason (PSR).
The social care Primary Support Reasons (PSRs) covered in this
section are:
- physical support: mobility need
- physical support: personal care need
- sensory support: visual impairment
- sensory support: hearing impairment
- sensory support: dual impairment
Key UK legislation includes: * The Equality Act 2010 which is the
UK’s legal framework designed to protect disabled people from
discrimination . * The Care Act 2014 which is the UK’s
legal framework for Local Authority provision for adults with care and
support needs under the principle of promoting wellbeing which includes
:
- personal dignity
- physical and mental health and emotional wellbeing
- protection from abuse and neglect
- control by the individual over day-to-day life
- participation in work, education, training or recreation
- social and economic wellbeing
- domestic, family and personal
- suitability of living accommodation
- contribution to society.
Physical and sensory disabilities become more prevalent with age,
along with other long-term conditions, such as diabetes and may impact
on mobility and personal care requirements. The average age of the adult
disabled person in London is 43.7 years compared to average of 37.5
years for people without disabilities. Preventative support at a younger
age may delay, reduce or entirely prevent the onset of further
conditions or reduce deterioration .
An estimated 30% of people with a long-term physical health condition
also experience mental health problems, most commonly depression and
anxiety, which can be exacerbated by social isolation. This can lead to
significantly poorer health outcomes and a reduced quality of life. It
is estimated that mental health problems increase the cost of NHS
treatment of limiting long term physical health conditions by an
additional £8,000 million to £13,000 million annually. The lowest
estimate equates to £1 in every £8 spent on limiting long term physical
health conditions .
Barriers
People with physical and sensory disabilities face several barriers.
These include :
- stigma surrounding disabilities and negative experiences can become
a barrier to accessing support services
- opportunities to make and sustain social contacts can be limited and
lead to isolation and loneliness
- sighted-guides and communicator-guides are often difficult to
obtain, and there is some difficulty in getting requests through the
locality teams due to lack of sensory knowledge
- barriers to employment mean that people with physical and sensory
disabilities are less likely to be employed, or be employed for fewer
hours and lower hourly pay, than other people with equivalent skills and
experience
- On average, a person with a disability spends 47% more on the costs
of day-to-day living
Wandsworth is committed to working with communities and local
organisations to reduce the impact of these barriers.
2.2 Prevalence and Level of Need in the Population
Using 2020 local prevalence rates, it is estimated there are over
46,300 people aged 18-64 (6.4%) whose ability to do day to day tasks is
limited by long-term condition or illness including physical, sensory,
learning disabilities and mental health conditions. Over 19,800 state
they are significantly limited.
Applying national age-related prevalence rates to Wandsworth 18-64
population it is estimated:
- 4.1% (22,000) mobility impairments
- 0.8% (4,200) visual impairments
- 0.5% (2,800) severe hearing loss
- 7.8% (41,600) some hearing loss.
All these numbers are expected to increase over the next 30 years as
presented in the table below.
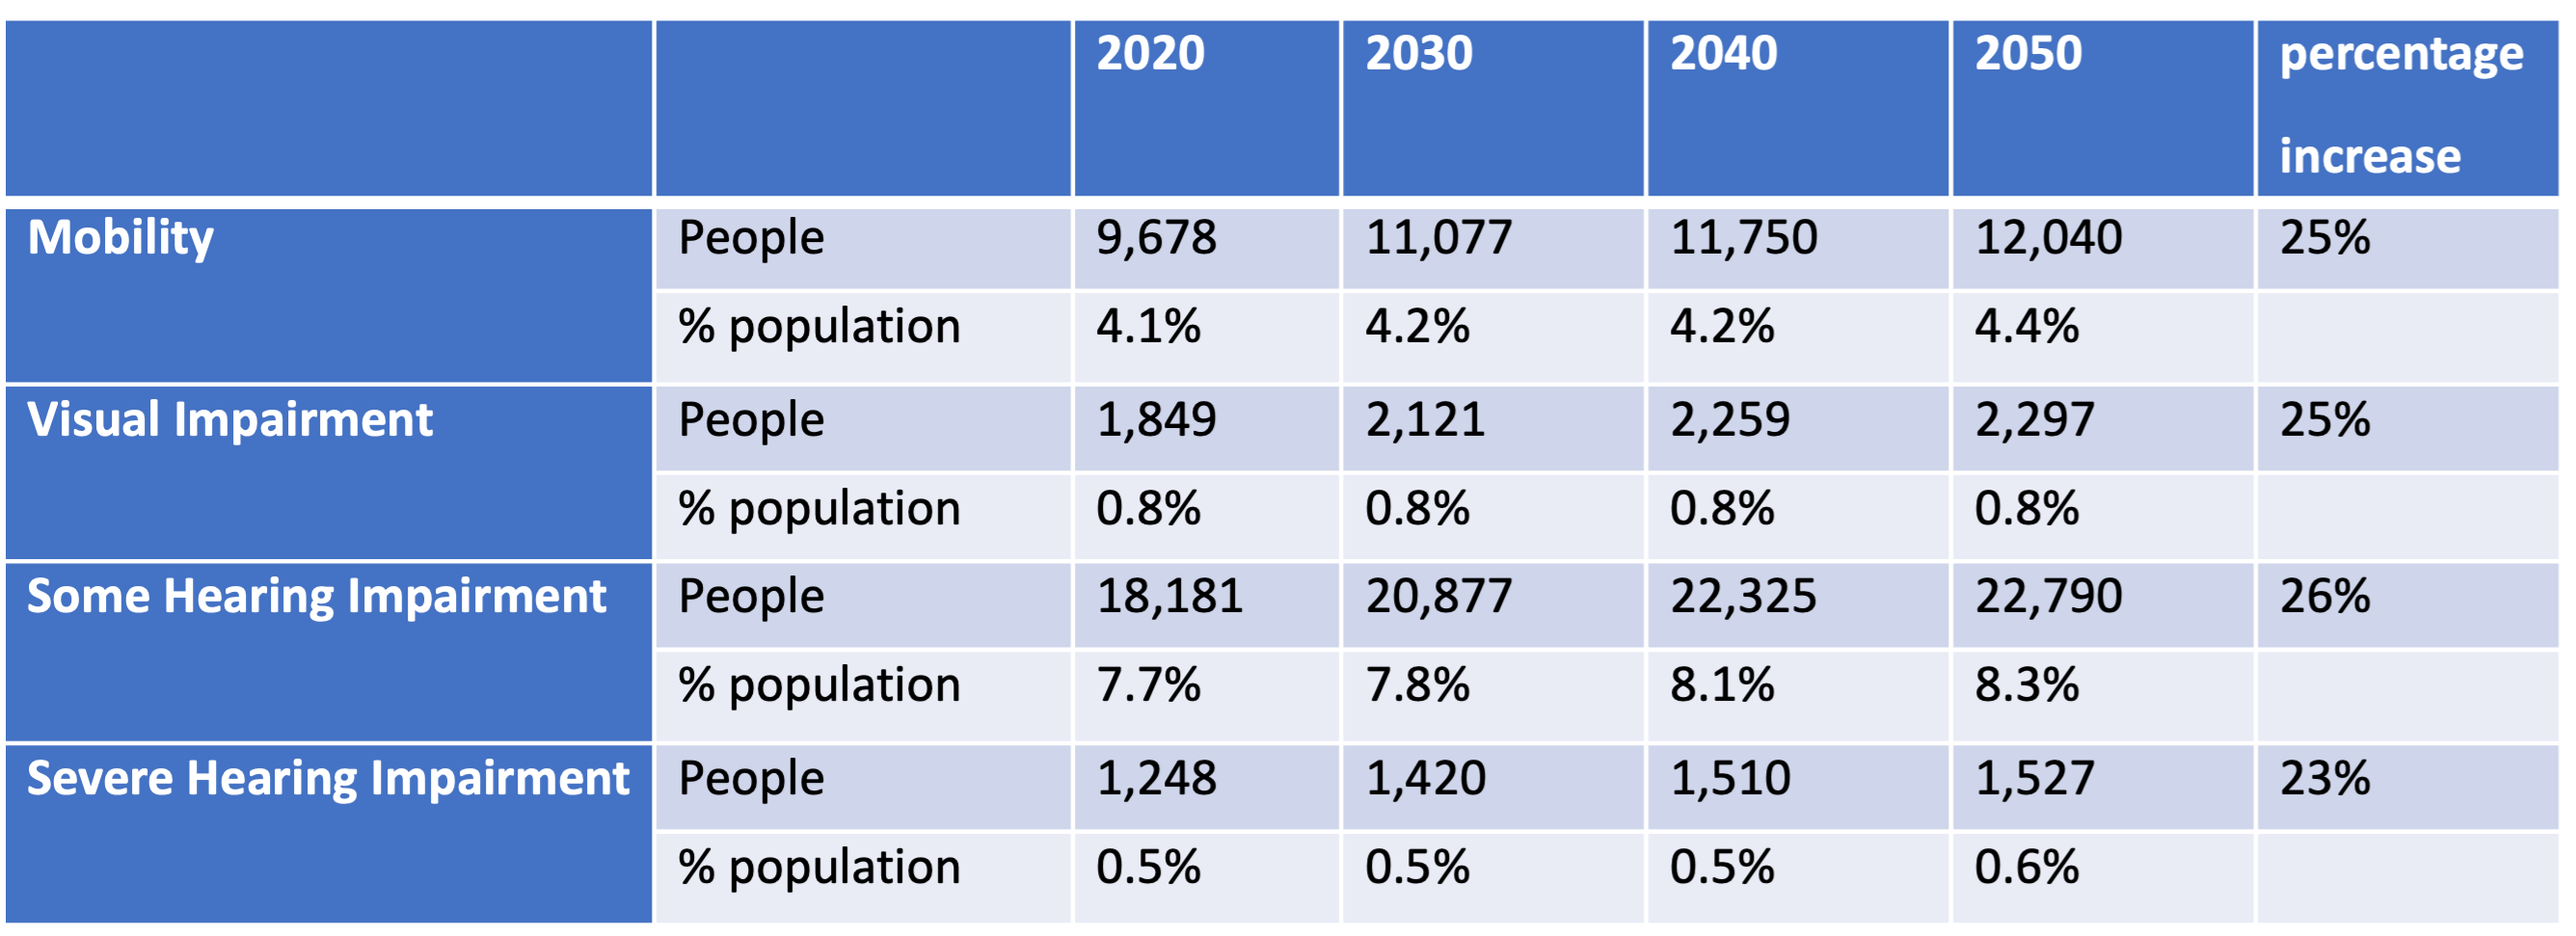
Estimates of the number of people with
disabilities in Wandsworth
Source: GLA population estimates; Deloitte Access Economics (2017)
and Office for Disability Issues, (2011b)
However, these are based on national age-related prevalence rates and
because of current and historical good services for hearing impaired
people in Wandsworth, the actual numbers of this group may be higher,
particularly in younger people with profound hearing impairments.
In 2018-19, there were a total of 451 adults aged 18-64 receiving
social care services in Wandsworth for physical health and sensory
needs, the table below.
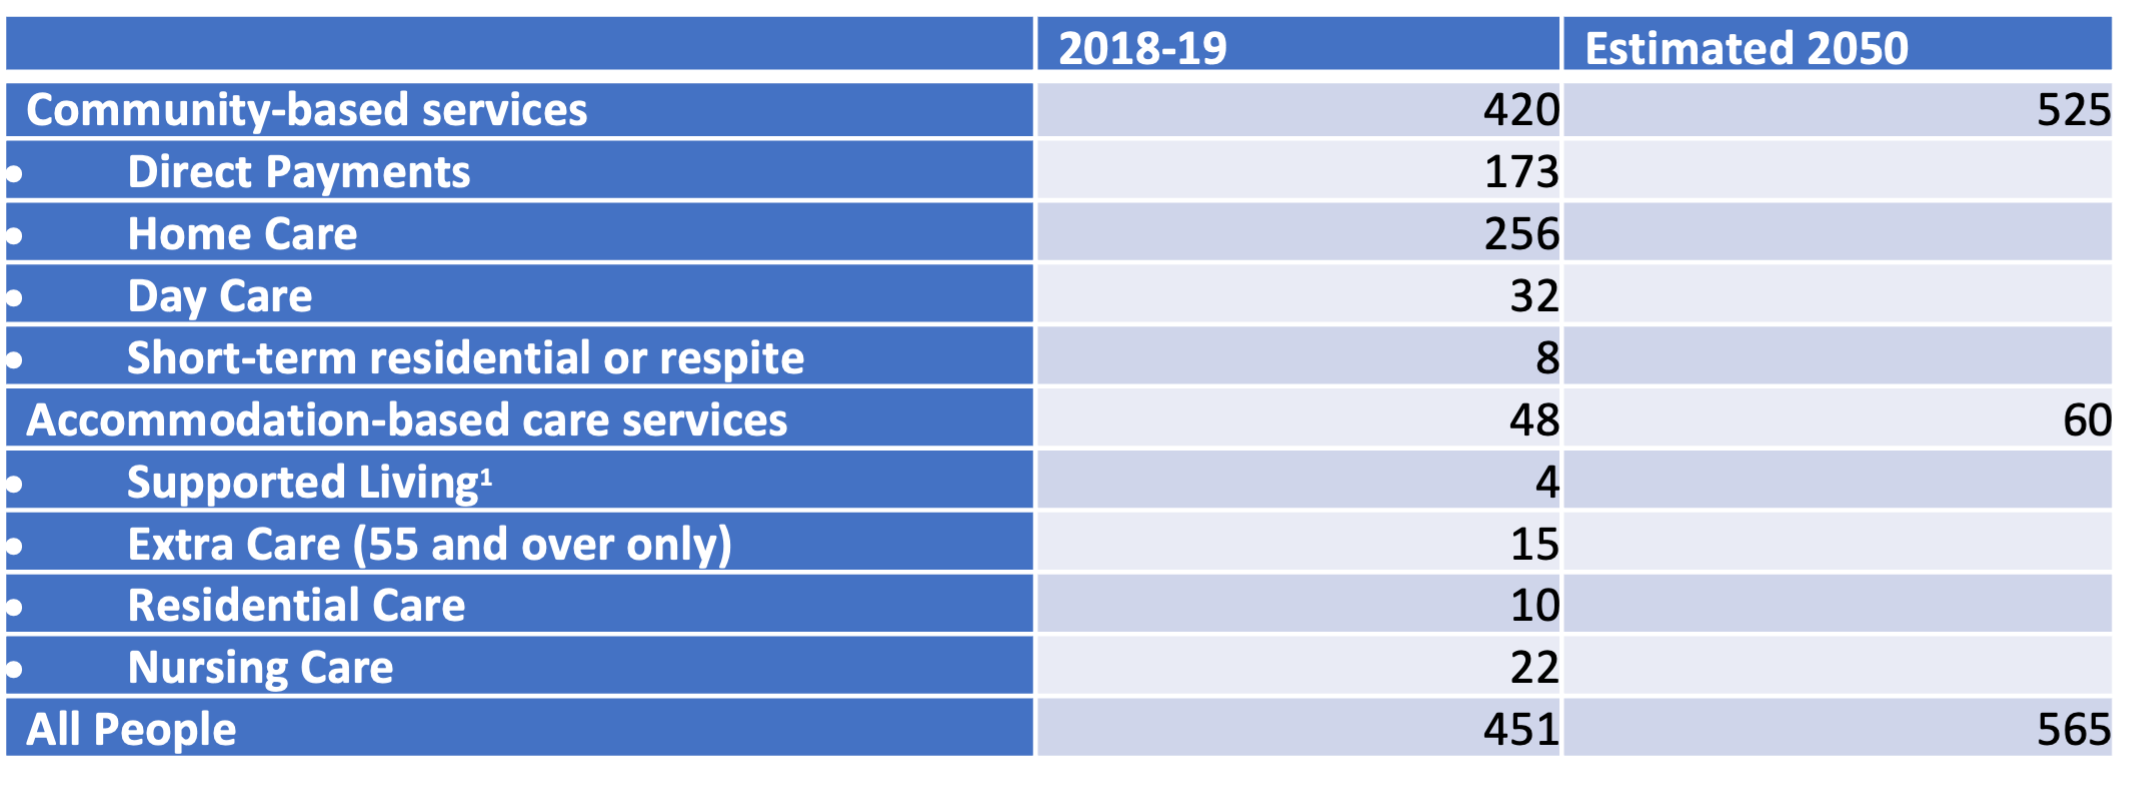
People receiving social care services in
Wandsworth with physical and sensory needs
Source: internal data
The proportion of people in this group receiving direct payments is
41%. While there is no specific benchmarking data for this group, the
overall proportion of people aged 18-64 receiving their community-based
services through direct payment is 28%, slightly lower than the England
(31%) and London (29%) averages.
Out of the 451 people, 97% had a physical impairment. 21% needed
mobility assistance only, and 75% required mobility and personal care
support. An increase of 25% was used to estimate need by 2050. Due to
the small numbers involved, the projections have a large margin of
error. Within this group, an increase in social care need is anticipated
and subject to change with unexpected external factors.
The proportion of the 18-64 year olds with mobility, visual and
hearing impairments is expected to increase by 2050. It is unknown how
the impact of the COVID-19 pandemic will have in terms of increasing the
number of people with long-term ill health or receiving social care
services. The projections and analysis of future trends is therefore
subject to significant margins of error. Much of the other data are
extrapolated from national prevalence rates. The estimates are based on
the age of Wandsworth’s population but not the specific socio-economic
profile of the Borough. Some people are reluctant to identify themselves
as disabled due to the potential stigma or prejudice. Others may be
deterred from formal services due to access difficulties (e.g., booking
appointments via a telephone system).
2.3 Current Services on Offer
Within the legislative framework Wandsworth has a duty to promote
wellbeing and ensure equality of opportunity for people with
disabilities. People with physical and sensory disabilities often face
barriers to undertaking day to day tasks which may require equipment,
adaptation and support, or social and cultural change within
communities. The national agenda for personalisation means putting
individuals strengths and preferences at the centre of their care.
Wandsworth follows a strength-based approach focussing on the abilities
of the individual rather than their disabilities in order to overcome
barriers and find solutions.
The Council continues to promote Direct Payment uptake to support
choice and control and expects providers to continue to offer and
develop a wider range of personalised and bespoke services. Currently
14% of this cohort are choosing to use this option to direct their own
care.
Where a person with eligible social care needs chooses not to manage
their own care through a Direct Payment, Wandsworth organises
appropriate community-based services such as homecare and day care.
Housing and Accommodation
There are no accommodation-based services that specifically cater for
this group in Wandsworth. However, there are four residential and three
nursing homes that will take working age adults with physical and
sensory disabilities. While recent admission figures are low for this
group, evidence is that Out of Borough Placements are used to ensure
people are placed in appropriate accommodation for their specific needs.
There are five Extra Care Housing Schemes that accept people from age
55+ (the figure below). Three of these schemes are commissioned by
Wandsworth Council and the other two are privately run.
A recent analysis of accommodation-based care needs suggested that
there may be a need for some locally based supported living
accommodation such as extra care provision for younger adults. This was
due to all current placements being out of Borough. However, the
conclusion was there was insufficient evidence for this need and further
work is to be to be undertaken to inform decisions.
There is a Sensory Impairment Service in Wandsworth which provides
services to visually impaired people including advice, equipment and
training. Facilities at Liden Lodge School include Wandsworth Hearing
Support and Vision Support Services. Voiceability Wandsworth is
commissioned by the Council to support sensory disabilities, and Blind
Aid provides support for reading and responding to mail.
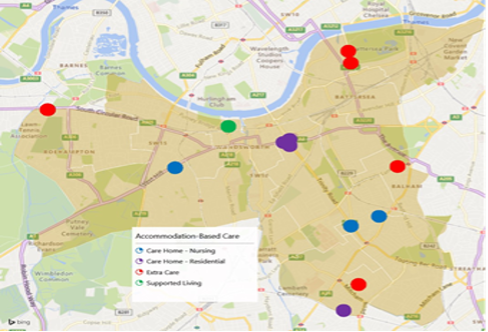
Location of accommodation-based care services in
Wandsworth
Source: internal data
2.3 Disability Prejudice, Social Isolation and Loneliness
Some of the barriers disabled people face involve lack of
opportunities to make and sustain social contacts, leading to isolation
and loneliness. This includes people with diverse impairments and
personal circumstances. The barriers that people face include :
- physical barriers such as limited access to social and community
groups for someone with mobility issues or visual impairment
- communication barriers such as those faced by people with hearing
impairments
- a national survey of people without disabilities 49% stated that
they did not have anything in common with disabled people, 26% admitting
that they have avoided engaging in conversation with a disabled
person
- one in three disabled people in a national survey feel that there is
a lot of prejudice against people with disabilities, another half feel
there is some prejudice. When the same question was asked of people
without disabilities, only one in five stated there was a lot of
prejudice
These barriers have a tremendous impact on the welfare and quality of
life of disabled people .
- 53% from a national survey reported feeling lonely regularly, 23%
saying they will feel lonely on any typical day
- 14% of people with a visual impairment say they never or rarely have
as much social contact as they like, and feel very or completely cut off
from people
- 30% of people with mobility issues say they are always or often
lonely
- 74% of people with an Acquired Brain Injury (ABI) say their social
life has been affected as a result of their impairment
- 22% of people living with cancer are affected by loneliness.
Loneliness and social isolation are known to negatively impact both
on emotional, mental and physical. Weak social connections can be as
harmful to physical health as smoking 15 cigarettes a day. Lonely
individuals are at a higher risk of increasing disability.
2.4 Employment/ Income and Cost of Living
The Care Act 2014 demands that Local Authorities provide support and
services in a way that promotes individual choice and improved
wellbeing. For disabled people, improving access to mainstream services,
education and employment, will lead to better health, social and
economic outcomes as the person is able to live a more connected and
meaningful life.
There is a significant difference in economic activity and employment
rates between people with and without disabilities . The national
estimates have been applied to the Wandsworth figures in the table
below.
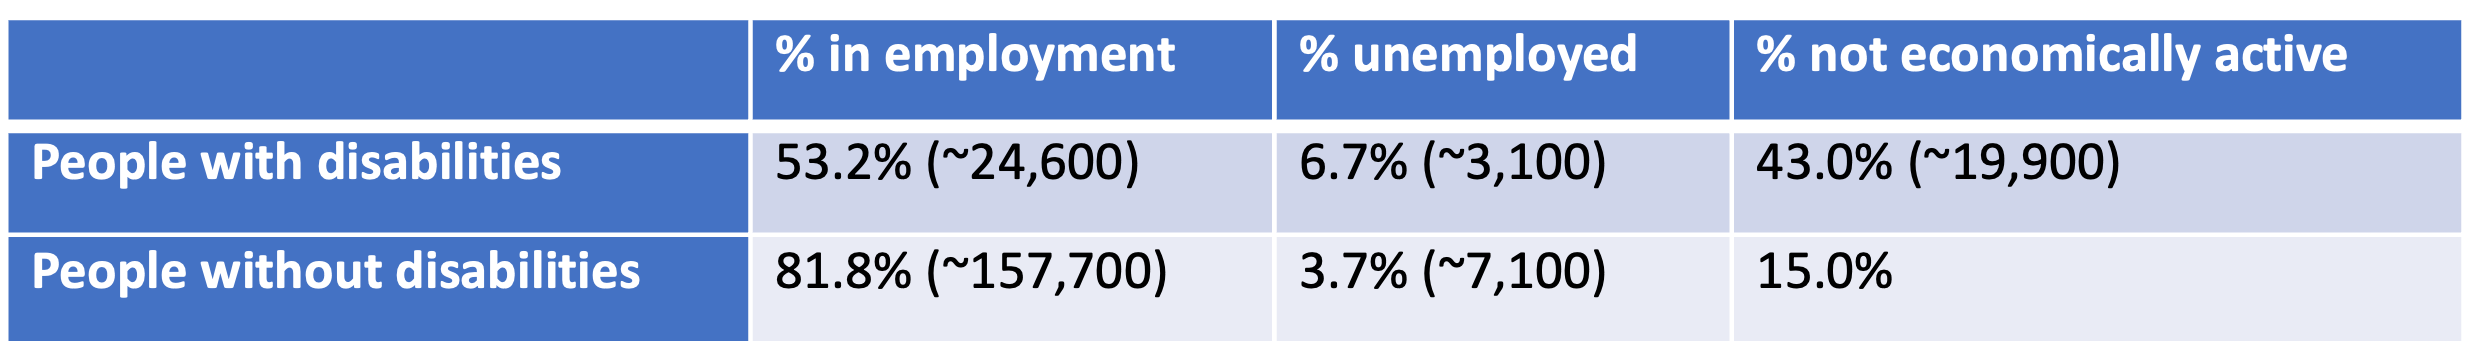
Comparison of estimated economic activity of
people with and without disabilities in Wandsworth
Source: House of Commons Library, 2020.
When people with disabilities are in employment, they are more likely
(34% compared to 23%) to be working part time .
Median pay is significantly lower for people with disabilities,
earning an average of 12.2% less per hour than people without
disabilities. The disability pay gap is wider in London than any other
area of the country, at 15.3% less being paid to people with
disabilities. Nationally, the pay gap for people with disabilities
employed as managers, directors or senior officials is the largest, at
13.1%. In addition the pay gap was largest for people aged 30-49 .
Life costs more for people with disabilities and their families who
have to spend, on average, an estimated 47% more than people without
disabilities (equivalent to a national average £585 extra per month).
One in five disabled people face extra costs of over £1,000 a month .
3. Learning Disabilities
3.1 Introduction
The focus of the commissioning model for learning disability services
is to reduce reliance on residential care. Service users are provided
with supported living and greater independence where possible, with
fewer out of Borough placements. In addition, the Council encourages the
provision of meaningful daytime activities and life skill development
opportunities with stronger pathways towards a measurable outcome. There
is a drive to develop and increase employment and supported employment
opportunities, increasing the number of people with learning
disabilities who are in paid (full or part time) employment, or
voluntary roles. The Council wishes to see services that cater for both
the younger learning disability population with more complex needs that
are transitioning and ageing cohort of people with learning
disabilities. Wandsworth Market Position Statement
A learning disability is a reduced intellectual ability and
difficulty with everyday activities such as household tasks, socialising
or managing money. The NHS defines a learning disability as “the way a
person learns new things throughout their lifetime, which means they can
have difficulty understanding new or complex information, learning new
skills and coping independently”. The severity of learning disabilities
exists on a spectrum from mild to profound. At its greatest severity, a
profound learning disability leaves a person with multiple disabilities,
including learning, sensory and physical impairment .
Although the two terms are occasionally used interchangeably, a
learning difficulty differs from a learning disability. A learning
disability is a condition that affects all aspects of life where “a
learning difficulty is an obstacle to a specific form of learning but
does not affect other aspects of life”.
Learning disabilities are now taking a more prominent position within
both national and local agendas. The Care Act 2014 requires Local
Authorities to meet a person’s needs holistically. This encompasses an
acknowledgement of the wider determinants of wellbeing, such as
employment or socialisation. The Care Act legislation is strengthened by
the Mental Capacity Act 2005 which protects the right of individuals
and their families to make their own decisions.
All people should have the opportunity to be active citizens, live a
meaningful life, and make contributions to the community.
To ensure that Wandsworth Council is providing the best outcomes to
residents, a Learning Disability Clinical Reference Group ensures that
services are the needs of local people. Importantly, the Group includes
representation of people with a learning disability and their families.
Service implementation is guided by key principles of the Wandsworth
Learning Disability Commissioning Strategy 2021-26 that focusses on:
- My Voice is Heard – Coproduction
- Where I Live – Housing and Care Support
- What I Do – Employment and Day Opportunities
- Becoming an Adult – Transition
- I am Fit and Healthy – Improving Health Services
- I have Choice and Control in my Life.
A learning disability occurs when the brain is still developing
(before, during or soon after birth) and there are several causal
factors including:
- genetic factors
- illness or accident while the mother is pregnant
- lack of oxygen or trauma during birth
- premature births
- early childhood illnesses, accidents or seizures.
Diagnosis of learning disabilities generally occurs in childhood.
Mild learning disabilities are mostly commonly diagnosed during school
age when issues with reading, writing and numeracy are highlighted.
Other issues with socialising may also present. These are often known as
‘hidden’ learning disabilities.
3.2 Prevalence and Level of Need
While the analysis in this section is pre-COVID, it is undeniable
that COVID-19 is going to have an impact on the needs of people with
learning disabilities in Wandsworth. National evidence shows that 30% of
the deaths of people with a learning disability between March and
September 2020 were from COVID-19. When the full impact of the pandemic
is known, including the potential long-term impacts of the virus, the
analysis will be revisited.
National prevalence rates applied to the age-related population in
Wandsworth show a predicted increase of 16% in the numbers of the 18-64
population by 2050. However, the increase in the 65+ population is
expected to be significantly higher, the table below.
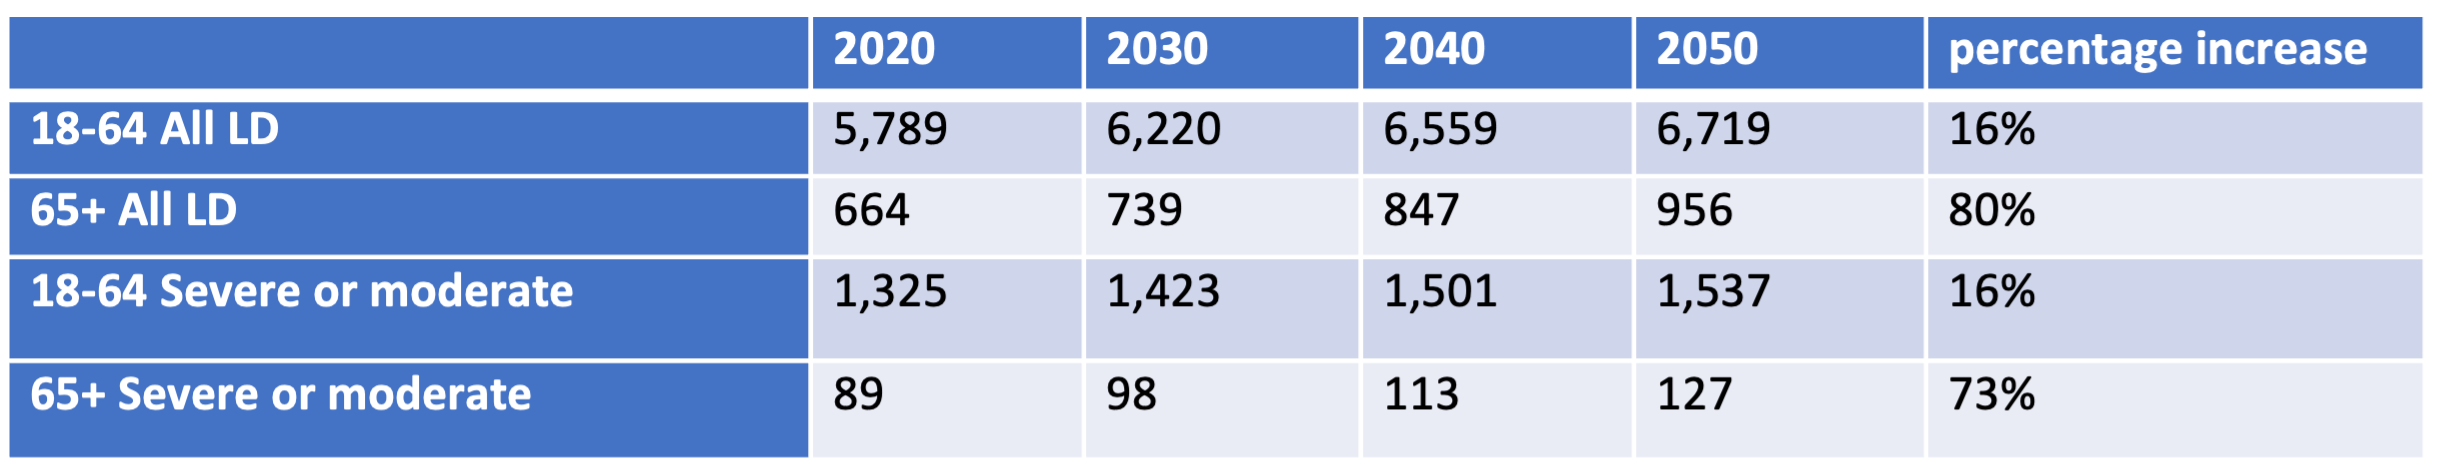
Projections of Wandsworth residents with a
learning disability 2020-2050
Source: GLA population estimates & Emerson & Hatton, 2008
Comparing the number of people on the GP Learning Disability Register
shows a similar figure to the London average. 49 in every 10,000 people
in London are on the GP Register of people with a learning disability,
the number in Wandsworth is approximately 48 people. Similarly, the
number of people receiving social care services with the primary need of
learning disabilities is 33 compared to 32 South West London, as shown
in the table below.
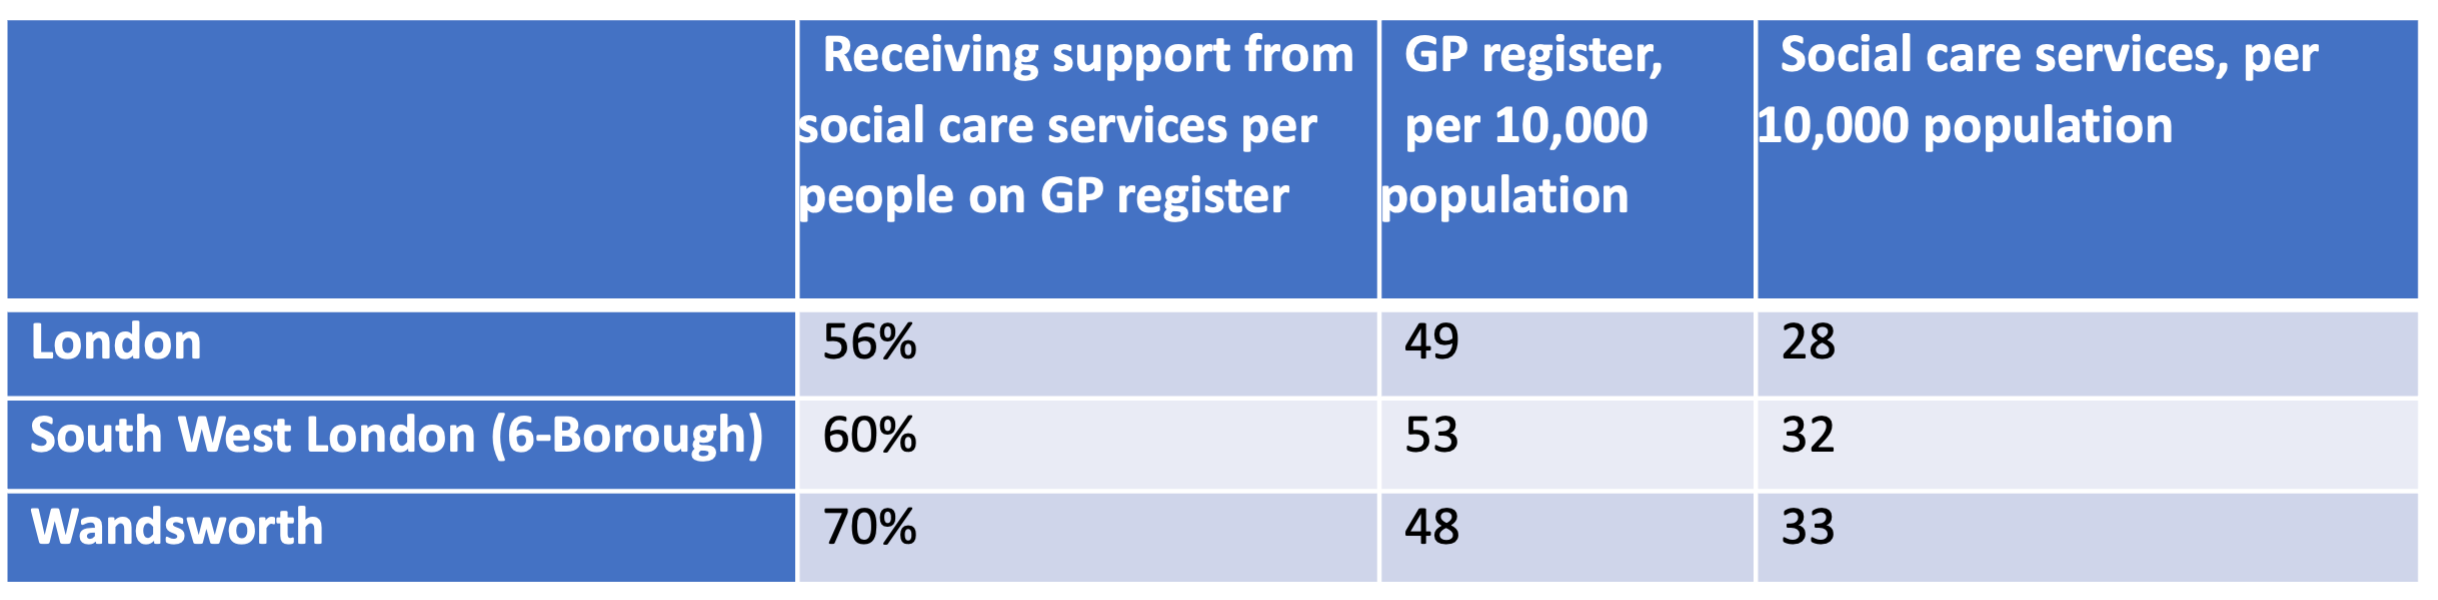
Key statistics on learning disabilities in
Wandsworth
Source: Public Health Profiles
In 2018-19, there were 829 people aged 18 to 64 years with a learning
disability receiving services, and a further 131 people aged 65 and
over, as shown in the table below. Direct payments were one of the most
common ways to support people with a learning disability in the
community, given the emphasis on choice and control.
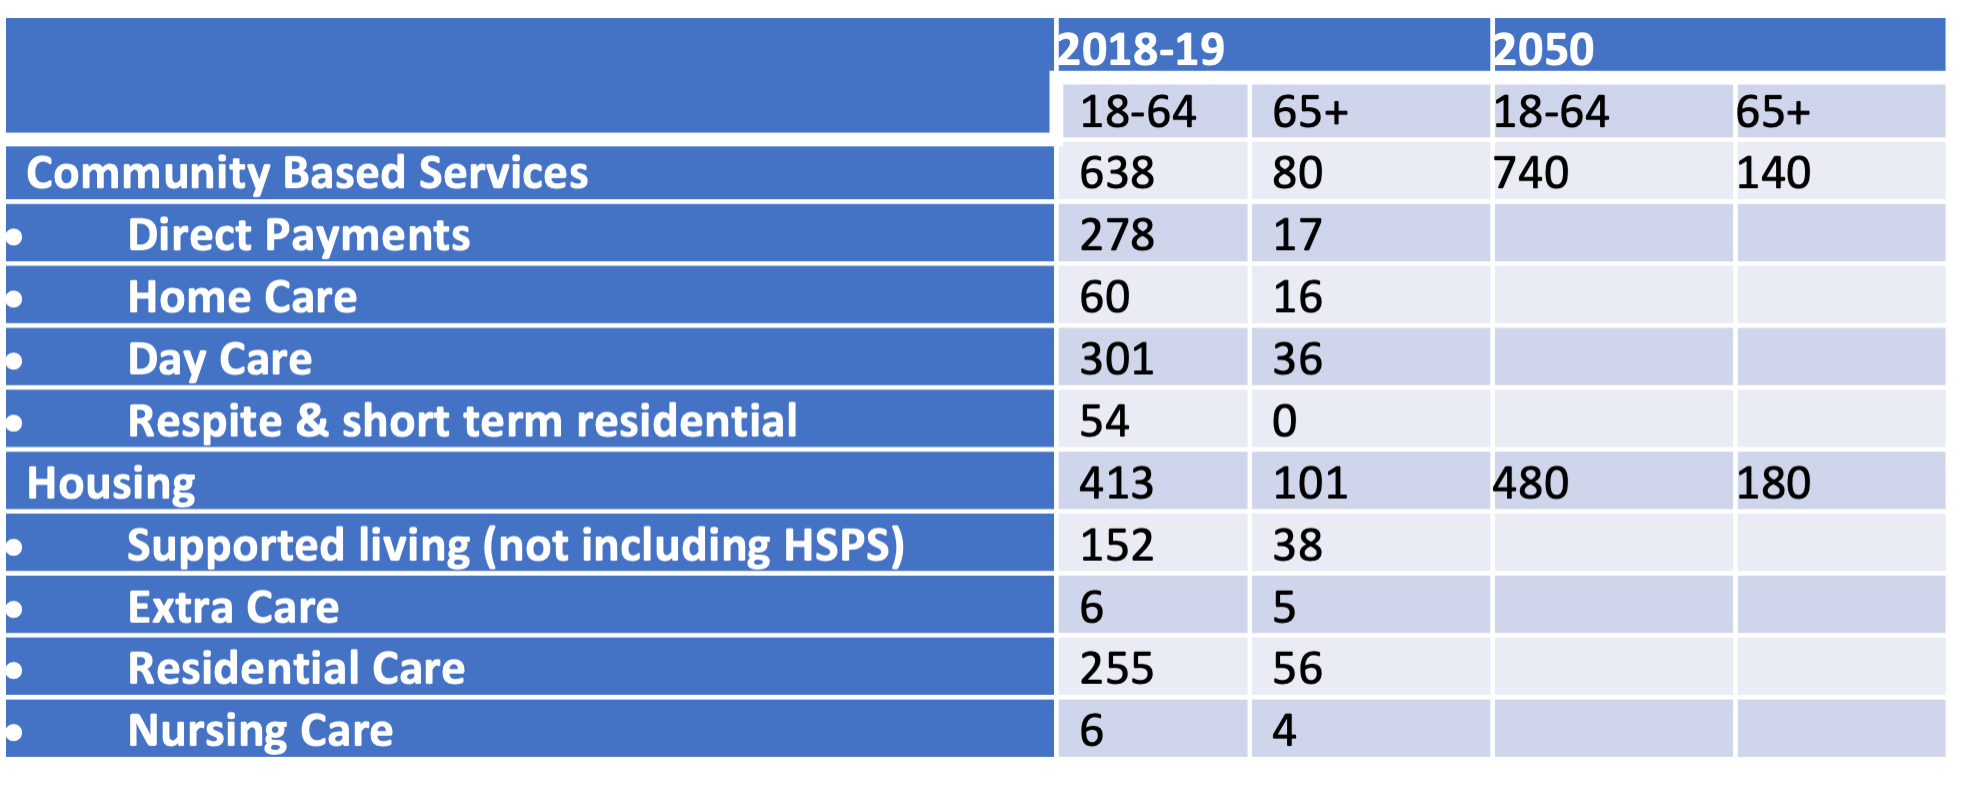
People receiving social care services for a
learning disability
Source: internal figures
The estimated increases to 2050 are based on the estimated population
rises of severe and moderate learning disabilities. The number of people
in nursing care look low. This is because these figures are based on the
primary care need of the person, not on all people with a learning
disability. As a person with a learning disability ages, their primary
need may become physical health or dementia.
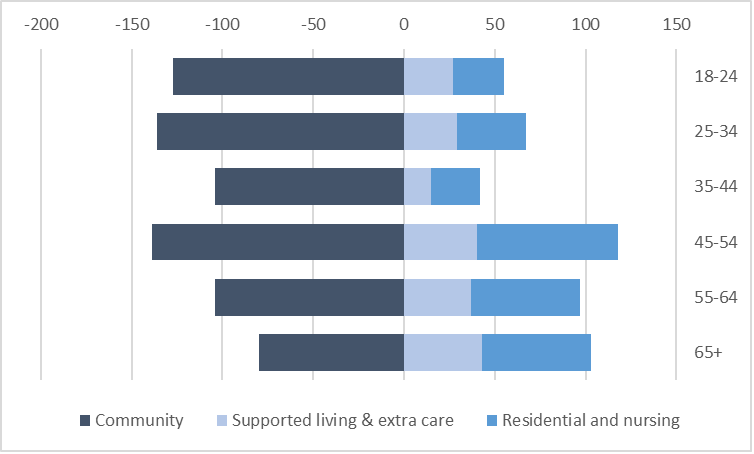
The figure below shows the number of people with a learning
disability receiving community based care (left hand side) and
accommodation-based care (right hand side) care by age in Wandsworth.
People with a learning disability aged 45+ are more likely to be placed
in accommodation-based support. More independent accommodation-based
care arrangements (supported living and extra care) make up more than
half the accommodation-based care placements from 18 to 44. From 45
years, people with a learning disability are increasingly likely to be
placed in residential care homes.
People receiving services for a learning
disability
Source: Richmond ad Wandsworth Council SSA Adult Social Services
Commissioning Division
Life Expectancy
The number of people living with a learning disability is expected to
increase in line with increases in the general population. Demand in all
areas is expected to rise. On average, females with a learning
disability live for 18 years less than the general population, males
with a learning disability for 14 years less. This is for a variety of
reasons including certain health conditions that have been found to be
more prevalent amongst people with a learning disability. For example,
epilepsy is 25.2 times and severe mental health conditions is 8.4 times
more prevalent than people without a learning disability :
- About 1 in 3 people with a mild to moderate learning disability also
have epilepsy. The more severe the learning disability, the more likely
the person will also have epilepsy
- People with Down’s syndrome will typically have some level of
learning disability, the extent of the learning disability will vary
individually
- As many as half of the people with cerebral palsy also have a
learning disability
- Studies vary in the overlap between autism and learning disability
but most show between 44% and 52% of autistic people may also have a
learning disability, and between 31% and 36% of people with a learning
disability may also be autistic
- People with a learning disability (particularly those with Down’s
syndrome) are at increased risk of developing dementia
- Older people with a learning disability experience age-related
issues at a younger age than the general population.
Primary Care
A national survey of 47% of people with a learning disability,
registered with a GP, showed there is lower attendance of health checks.
For example, only 31% of women have had smear tests compared to 73.2% of
the general population. A person with a learning disability may also
require higher levels of explanation regarding a diagnosis or health
deterioration, including an easy read format and the involvement of
advocates. Research found that 38% of people with a learning disability
died from an avoidable cause, compared to 9% in a comparable population
.
In Wandsworth, 53% of adults with a learning disability on GP
Registers had a health check during 2017-18. This is similar to the
England’s average (52%) but slightly lower than the London average
(57%).
Social Isolation
Evidence reveals that high-quality friendships are associated with
better physical health and lower risk of early mortality. A lack of
social interactions can increase the likelihood of high blood pressure,
heart disease, obesity, weakened immune system, anxiety, depression and
cognitive decline. A recent survey stated that 45% of people with a
learning disability felt they did not spend enough time with friends,
with 18% feeling alone and cut off from other people .
People with a learning disability may have limited opportunities for
inclusion to a variety of social groups and may be limited by
availability of services or carer preferences.
In some communities there are low levels of awareness and
understanding from the general public who may not involve and value
people with a learning disability.
Many people with a learning disability aspire to having a loving
relationship. However, only 3% of people with a learning disability live
as a couple compared to 70% of the general adult population. Support
workers and family members can play an influential role in either
supporting or preventing people developing and sustaining these
relationships
Meaningful Activity, Employment, Training and Education
Less than two in ten people with a learning disability are in
employment, which decreases further for those living with a severe
learning disability. In Wandsworth, the latest statistics show 11% of
people with a learning disability (known to services) are in paid
employment compared to the London average of 7.5% and England average of
6.0%. The gap in employment rates in Wandsworth is similar to the London
(66%) and England (70%) averages .
Meaningful activity needs to be tailored to the individual needs of
the person. The assumption that all people with a learning disability
need the same service runs counter to the strengths-based approach to
social care, and the personalisation agenda. Activities need to fit the
interests of the person as well as being age appropriate. Wandsworth has
a firm commitment to achieving equality for those with a learning
disability and the wider population. Evidence shows people with a
learning disability feel they do not get the social contact they need,
and meaningful activity levels can be low .
Meaningful activity must be tailored to the individual needs.
Wandsworth is committed to expanding a strength-based approach,
commissioning services and support which are appropriate for
everyone.
Research demonstrated 38% of people with a learning disability died
from an avoidable cause versus 9% in a comparable population. Easy
access to health care is key to helping people with disabilities live
long and healthy lives .
Housing
Two thirds of people with a learning disability remain living with
their families. As the family ages, this situation may become
unsustainable. If long term support plans are not in place for the
person with learning disability may result in multiple moves and
placement in inappropriate accommodation .
In Wandsworth, 73% of people with a known learning disability are in
settled accommodation, similar to the London average (73%), lower than
the England average (77%). An alternative measure of people with a
learning disability in stable and appropriate accommodation showed 74%
in Wandsworth, similar to the London average of (75%).
Transition
Young people with a learning disability transitioning into adulthood
face a variety of challenges. These include : • some young people
receiving SEND support in childhood may not be eligible for adult social
care support because the criteria is set at a higher level. This is an
area of potential unmet need as this group are vulnerable to
exploitation and anti-social behaviour • different legislative
frameworks relating to under 18 (children) and over 18 (adults) mean
different expectations of available support • contributions towards the
cost of adult support is dependent on the income of the person with
learning disabilities • young people with a profound or multiple
learning disabilities may find it difficult to comprehend the changes
that are occurring with their life and support packages • as a young
person with a learning disability grows up, they may find that they want
to live more independently • moving out of the family home can cause
more challenges and the young person may need specialised support,
either accommodation-based or community-based.
The change into adulthood (and adult based services) can be deeply
stressful for many young people with a learning disability and
transition is, therefore, a key area of priority within Wandsworth. The
0–25 team in Wandsworth’s Children’s Services was set up to address
these changing needs.
3.4 Current Services on Offer
Partnerships with the NHS and the vibrant voluntary sector add to the
variety of services that support the wellbeing of people with a learning
disability in Wandsworth. The Community Learning Disability Health Team
(CLDHT) run by South West London and St George’s Mental Health Trust
provide a specialist pathway to people with learning disability needs
who may have difficulty accessing mainstream services. Specialist
services include support of dieticians, dysphagia practitioners and
speech and language therapists. One Trust is a registered charity that
promotes the wellbeing of people with learning disabilities through day
centre support. The organisation aims to ‘maximise the potential’ of all
people by tailoring support specifically to the person and their
families. In Wandsworth there are services available to ensure the
specific health needs associated with learning disabilities are met.
Partnerships with the voluntary sector also ensure that people with a
learning disability receive holistic services that enable them to lead
fulfilled lives.
There are several out-of-borough residential care placements for
Wandsworth residents. Moving a person with a learning disability
regularly can be disruptive for the individual, family and social
networks. The priorities are for new placements is to keep people
in-borough, and to bring people back in-borough when possible.
There are 12 residential care homes in Wandsworth designed
specifically for people with a learning disability, and another two
general needs care homes.
There is one Supported Living and four Housing Support and
Preventative Services (HSPS) schemes (some consisting of multiple homes)
for people with a learning disability. In addition, some HSPS Support is
given as floating support in locations around the Borough.
In Wandsworth HSPS operates as a Block Contract Service in addition
to the supported living provisions which are spot purchased. HSPS is a
local term which refers to services that would formerly have been
commissioned under the Supporting People Programme. Whilst both HSPS and
Supported Living provide a range of support to tenants, there are key
differences:
- HSPS is not regulated by the Care Quality Commission (CQC).
- Supported Living is not necessarily regulated by CQC, but elements
of personal care may be subject to personal care
- HSPS provides housing related support services only and does not
include personal care or domestic support
Although the number of units varies over time, there are currently
approximately 20 units (the figure below).
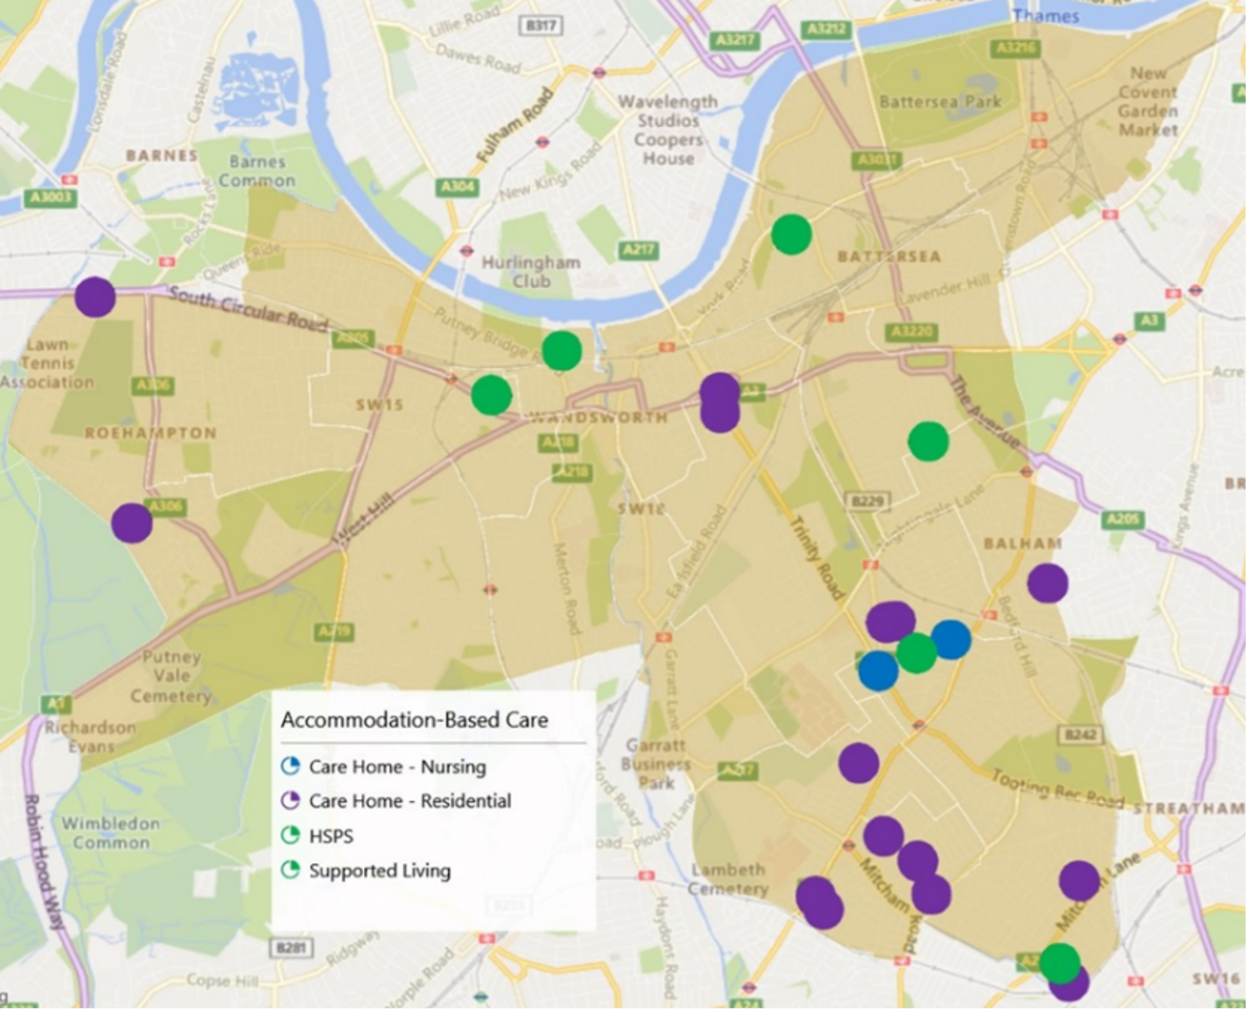
Map of accommodation-based support for Learning
disabilities in Wandsworth
Source: Richmond ad Wandsworth Council SSA Adult Social Services
Commissioning Division
Transition
The transfer to adult services can be deeply stressful for many young
people with a learning disability. Wandsworth regards this as a priority
for support and, where young people are not eligible for adult social
care services.
Settled Accommodation
Two thirds of people with a learning disability remain living with
their families. As the family ages, this situation may become
unsustainable. In Wandsworth, the number of people with a learning
disability in settled accommodation is lower than the London and England
averages. While these figures may be skewed by the lack of
identification of people with a mild learning disability, an area which
needs further exploration.
There is a high proportion of older people with learning disabilities
who receive support in care homes. Further analysis should be undertaken
to explore if older people with a learning disability have services
which enable them to remain living independently at home if they
wish.
A high proportion of people with a profound learning disability are
cared for in out-of-borough placements, highlighting the lack of
appropriate support locally. Moving people with a learning disability
away from familiarity and their families can cause emotional stress for
everyone.
The dynamics of learning disabilities in Wandsworth is varied with an
increasing proportion of learning disability needs in older people. A
variety of services are available to support those with greater need in
the community or in accommodation. The voluntary sector services
advocates and promotes rights and independence through holistic
approaches.
The prevalence of learning disabilities in older people is set to
increase significantly by 2050 . Services must develop so learning
disability needs continue to be met holistically, including social and
economic aspects. Wandsworth needs to ensure services for older people
include provision for people with a learning disability. Many people
with a learning disability may receive accommodation-based support for a
primary need other than learning disabilities.
4. Unpaid Carers
A detailed needs assessment was carried out in 2019 and is available
on DataWand. This
section summarizes the key points and updates some of the figures.
4.1 Introduction
“Our vision in Wandsworth is to raise awareness of the vital roles
played by carers and young carers; to collectively provide good quality
personalised support to carers, and young carers and those they care
for; to build solid networks ensuring that carers and young carers know
where to go for information and support; to enable carers and young
carers to balance their own lives with their caring roles, and; to
ensure that local service providers understand these needs and are
committed to working together to meet them.” Wandsworth Market Position
Statement
Unpaid carers provide invaluable support to the people they look
after, and to health and social care services. However, the life of a
carer can be hugely challenging. Carers may be at risk of social
isolation, losing employment and education opportunities, as well as
caring having a detrimental impact on physical and mental well-being.
Carers must remain a high priority for central and local governments to
ensure they feel they have choices, respect, and value.
A carer is anyone who provides care to a friend or family member who,
because of a limiting long-term condition or addiction, is unable to
cope independently. Nationally, it is estimated that the number of
carers will increase by 60% to 3.4 million people by 2030 .
Wandsworth estimates are shown in section 4.3.
The Care Act 2014 and the Children’s and Families Act 2014 recognises
the importance of carers and aims to promote their physical and mental
well-being. All carers (including young carers and adult carers of
children) have a right to a carer’s assessment and relevant support .
The 2010 National Carers Strategy aimed that by 2018 every carer
should be:
- recognised and supported as an Expert Care Partner
- enjoying a life outside caring
- not financially disadvantaged
- mentally and physically well and treated with dignity
- children will be thriving, protected from inappropriate caring
roles.
The National Carers Action Plan 2018–20 outlines a range of
cross-cutting governmental actions based on five key themes:
- services and systems that work for carers
- employment and financial well-being
- support for young carers
- recognition and support for carers in the wider community and
society
- building research and evidence to improve outcomes for carers.
The social, financial and health impacts upon carers can be
considerable. People providing unpaid care may be unable to protect
their current and future financial security .
Most of the care is provided by family, friends, and relatives. The
care they provide is worth an estimated £132bn per year . Notably this is
more than total spending on the NHS, which was 124.7 billion in 2017/18
.
This equates to an average of £20,300 contribution from each unpaid
carer in the UK. If this average was applied to the Wandsworth Carers,
it is estimated that they provide over £450 million of care.
Despite the significant contribution carers are making to society and
the health and social care system, the 2017 State of Caring Survey found
that 73% of carers felt that their contribution was not valued or
understood by government. Therefore, it’s vital that carers are given
the recognition and support they need to continue to provide care.
As people are living longer with health and social care needs, the
gap between the number of carers and the number of people with limiting
long-term conditions is increasing. This means:
- an increasing number of people will become unpaid carers with all
the increasing attendant needs
- an increasing need for social care support for people without an
unpaid carer.
The number of “sandwich carers” (those looking after young children
at the same time as caring for the older generation) is expected to rise
as are the number of people with ageing parents increases.
4.2 Identification of the Caring Role
The number of carers in the 2011 Census compared to the
number of carers known to services, indicates there is a gap in
identification. Carers often do not recognise their role and only
associate with their primary relationship to the person. Most of us will
look after an elderly relative, sick partner, or disabled family member
at some point in our lives. This invaluable service undoubtedly ensures
the continued health, well-being, and comfort of many cared for people.
One of the reasons people require social care services is due to unpaid
carers becoming unable to continue. Failure to identify carers and offer
support at an early stage represents a potential future risk.
Data show three in five people will be a carer at some point in their
lives. Women are more likely to be carers, often with multiple caring
responsibilities such as for children and elderly relatives. Older
people often become carers for their partner .
The UK 2011 census showed the proportion of the
population who were carers had increased and evidence and this trend is
likely to continue. The number of people aged 65+ is increasing more
rapidly than the general population.
83% of carers care for one person. However, 14% care for two people,
and 3% are caring for three or more people. The largest group receiving
care is parents and parents-in-law (the table below). Carers of older
people make up approximately three-quarters of all carers. Middle-aged
carers may have dependent children whilst also caring for older
parents.
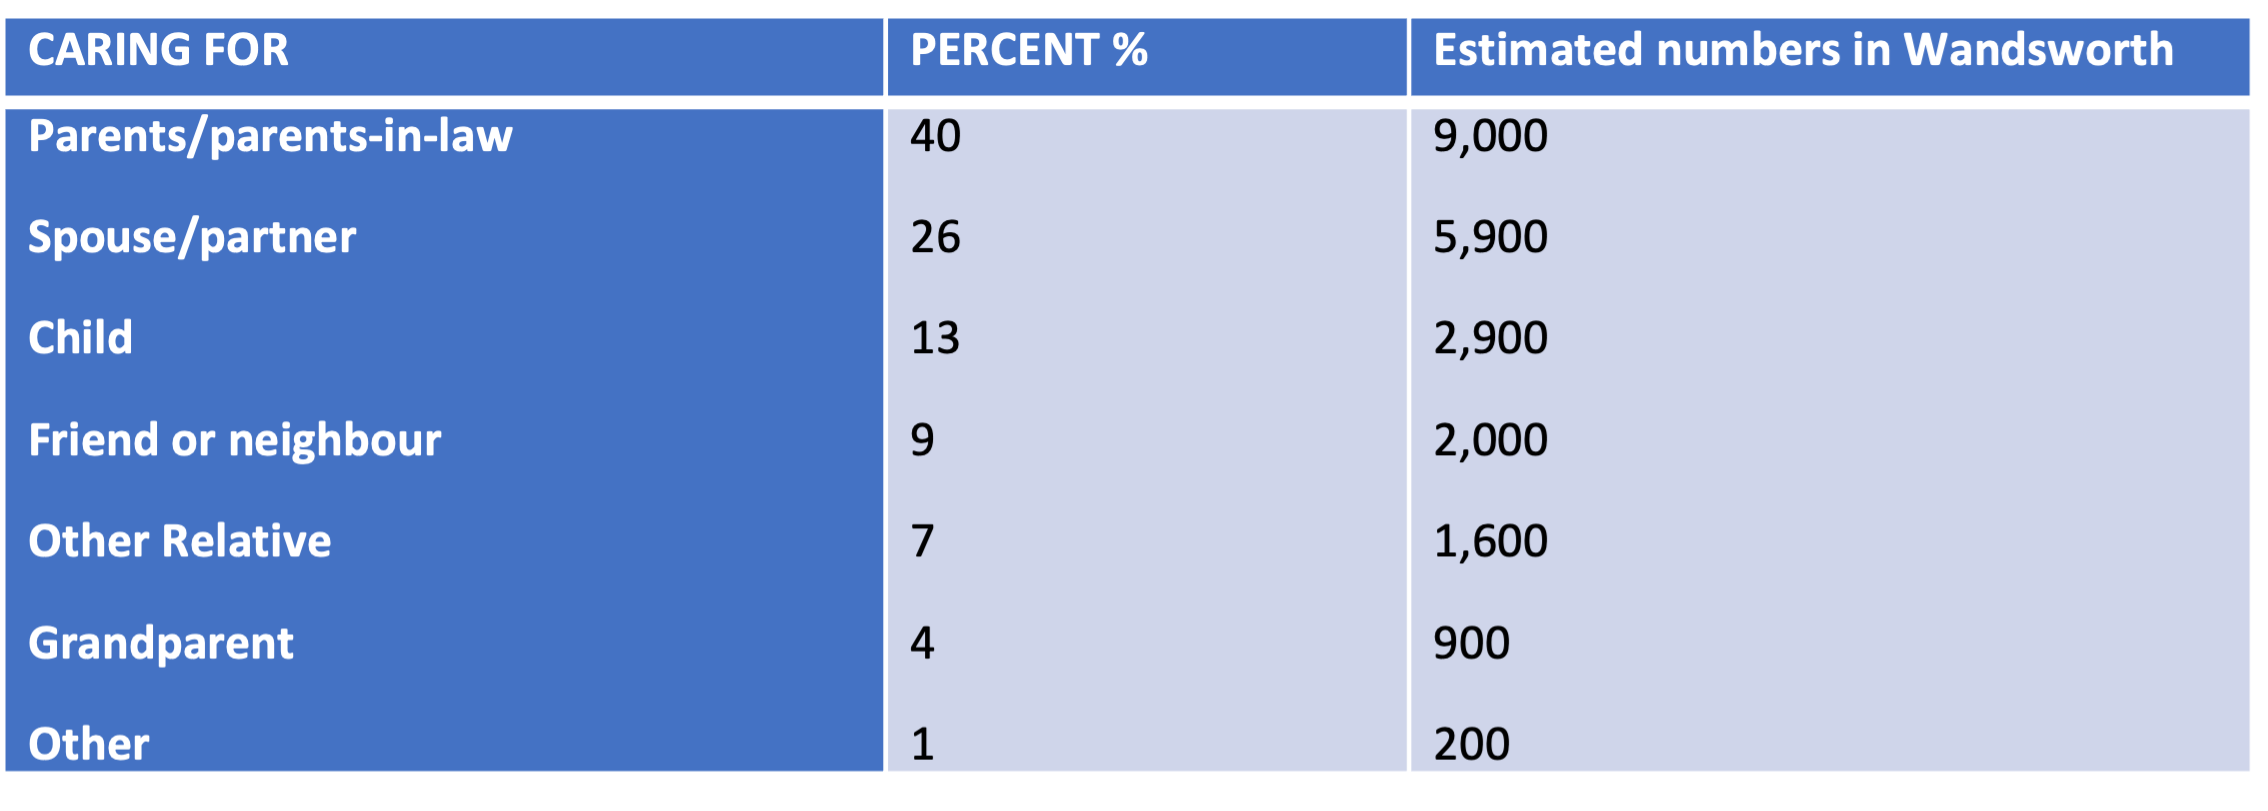
Cared for person by percentage of UK
carers
Source: ONS: Census 2011
Young Carers
The 2011 Census identified there are 1,719 young carers under 25
years providing unpaid family care in Wandsworth. Assuming the same
proportion applied to the 2020 population, an estimate 1,890 children
and young adults are providing care.
All young carers identified by the Council are offered assessment and
appropriate support through the Wandsworth Children’s services.
Many young carers take on their role because of multiple care needs
in the family. Growing up in such an environment, young carers mature
quickly and gain practical skills that aid independence. However,
national research shows that caring can have an adverse impact on
educational attendance, attainment, physical and emotional health,
social activities, and individual aspirations. Young adult carers’
responsibilities may delay them for moving away from home, reducing
employment possibilities, and accessing further education .
Transition arrangements are crucial for improving employment and
higher education opportunities. Carers aged between 16 and 18 years are
twice as likely not to be in education, employment, or training. Of
those who are in education, 56% at college or university said they were
struggling with their studies. 30% said they may have to drop out (17%
because of their caring role and 13% for financial reasons). Young
carers are three times more likely than their peers to have a mental
health condition .
55% of young carers provide care to a parent whilst 25% care for a
sibling. 80% of young carers are helping with practical tasks such as
cooking and household chores. Responsibilities tend to increase with age
.
Young carers risk being hidden and not receiving appropriate support
because :
- they do not realise they are a carer or that their life is different
to their peers
- their parents do not recognise their children are carers
- they do not want to be different from their peers
- one in four young carers were bullied specifically because of their
caring role
- they worry the family will be split up and they, or their siblings,
may be taken into care
- their parent’s condition may not be obvious, so people do not
realise they need help
- no opportunity to share their story
- lack of understanding of available sources of support.
Even when young carers are known to services, some will under state
their caring role and the affect it has on them. In the 2011 census, 442
children aged 0–15 years and 1,348 young people aged 16–24 years,
provide unpaid care in Wandsworth. The experiences of LGBT+ young adult
carers can be even more challenging. Research by the Carers Trust
indicates that LGBT+ young adult carers are three times more likely to
experience bullying than young adult carers. They are three times more
likely to have a mental health problem than their peers .
Parent Carers and Sandwich Carers
Applying national research to Wandsworth’s population it is estimated
there are 2,900 parent carers, approximately 13% of the carer
population. Some of these will be caring for “adult children”. However,
there are 5,800 school pupils who have Special Educational Needs and
Disabilities (SEND). Most of these children will be cared for by their
parents but some may not. This suggests a discrepancy between the number
of parent carers identified, and the total number of parent carers .
Sandwich carers are those who combine care for an older relative with
a range of other responsibilities, such as looking after their own
children, caring for another family member, or friend. Often, they do
not identify themselves as carers, especially because higher numbers of
this group are caring from a distance.
The number of sandwich carers is rising due to the pressures of an
ageing population, combined with people starting families later. Over
the last ten years the number of middle-aged (50–64) female carers has
risen by 13%, to 1.2 million. This is a sharper increase than the total
carer number of 11% (Carers UK, 2014). In Wandsworth 20% of women aged
50 to 64 are carers, compared to 14% of men .
Parents who provide care for their children often do not identify
themselves as carers and may be unaware of the support available for
them. Data show that 37% of parent carers took longer than five years to
recognise themselves as a carer (compared with 24% of all carers). The
“parent” and “carer” roles are intertwined. Residents are most likely to
be carers if they are between 50 & 65, 46% of carers are aged
between 25 and 49 years, and 30% between 50 and 64 years .
Black, Asian, and Minority Ethnic (BAME) Carers
In Wandsworth, 2011 Census data revealed 47% of the population are
from BAME Groups. The population of unpaid carers who are from BAME
groups is similar at 45%. The lack of identification is a key barrier to
recognising and managing the effects on health and well-being.
Furthermore, it prevents carers from accessing support and services .
4.3 Prevalence and Level of Need
Estimated Population Prevalence
The 2011 census showed there was a total of 19,728 carers
living in Wandsworth, 6.5% of the population. This varies by age
with:
- 2.1% 0–24 years (1,719)
- 5.7% 25–49 years (9,015)
- 16.7% 50–64 years (5,944)
- 11.8% aged 65+ (3,050).
Carers in Wandsworth are less likely to be in good health than people
who provide no care. People who do 50 of more hours of unpaid care each
week are much more likely to be in bad, or very bad, health (the table
below). 37% of carers in Wandsworth had an appointment with a GP in
2018–19 for an issue related to their caring duties.
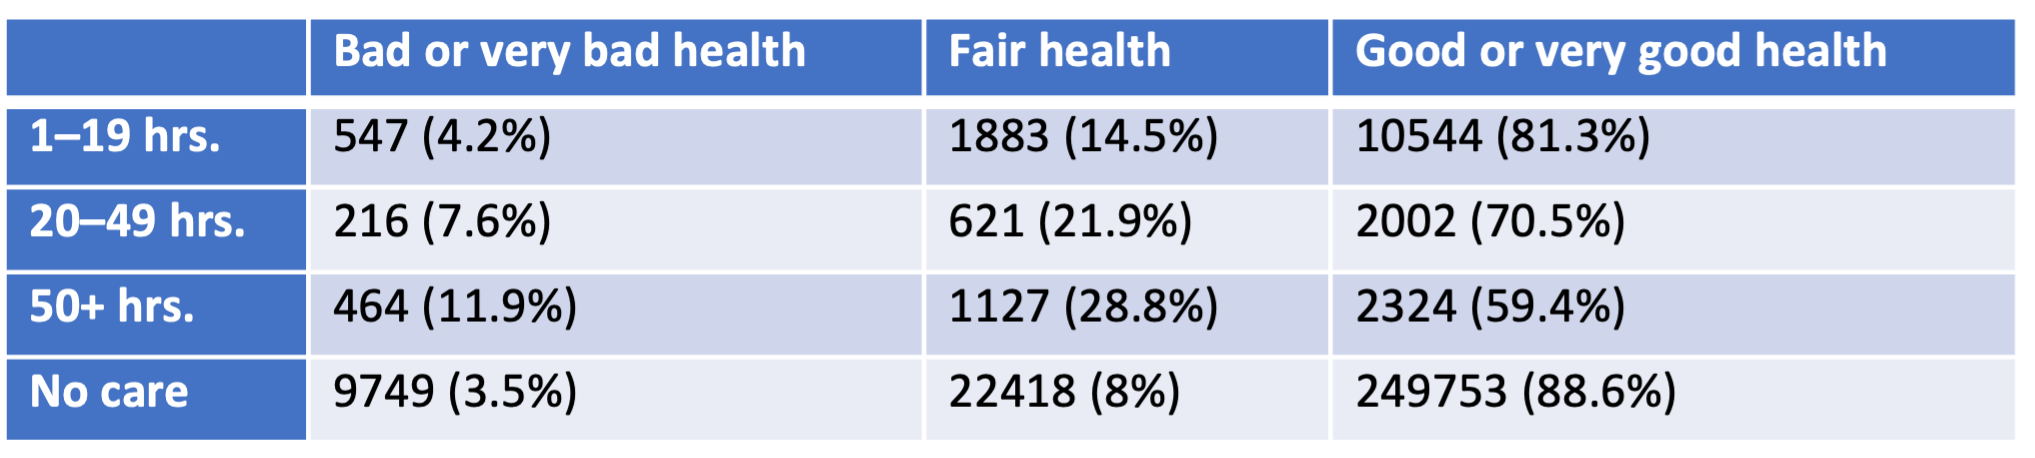
Carers in Wandsworth by number of hours of care
and self-described health
Source: ONS: Census 2011
While some residents may be caring for people living outside the
Borough, there are other people living in the Borough who have carers
living elsewhere. There is no data to show that either group has a
significant impact on the figures below.
People are living longer with multiple morbidities. The population of
Wandsworth is ageing with an estimated increase by 2050 of 87% of people
65+ compared with 16% of those aged 18–64. This is even higher in the
85+ age group which is expected to increase from 9,300 in 2020 to 26,500
in 2050.
Projecting the percentage of carers from the 2011 Census on to
the estimated population gives an estimate of 22,600 carers in 2020,
expected to rise by 30% to 29,400 by 2050. The number of people with
long term conditions that limit their ability to do day to day tasks is
expected to increase from an estimated 80,600 in 2020 by 54% to 124,000
in 2050 (the figure below). The gap between the number of carers and the
number of people with limiting long term conditions is increasing.
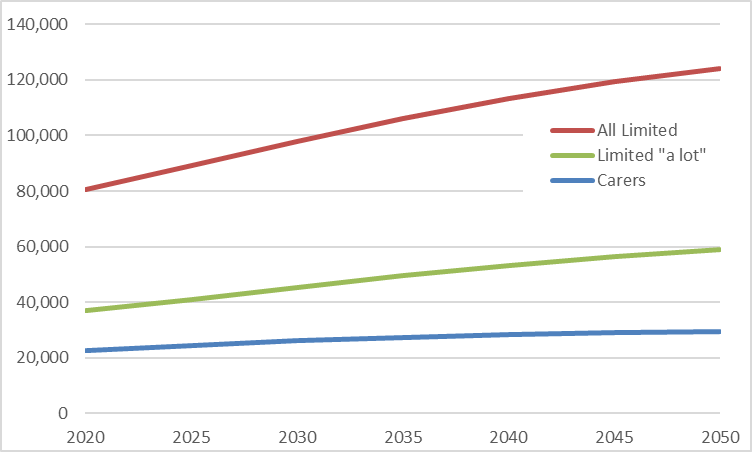
Estimated projections of the number of
Wandsworth residents with limiting long term illness and residents who
are carers
Source: ONS: Census 2011 & GLA population projections
The gap is likely to increase as more of the population becoming
carers. This will put more pressure on social care services and the
voluntary sector. It is probable some people support will not have
access to their own carers.
Impact of Caring on Health
The barriers to maintaining health and well-being are far greater for
people who provide unpaid care, whether from lifting and moving strains,
getting enough sleep, or having the time to make healthy meals. Those
providing care for more than 50 hours a week are twice as likely to be
in bad health as non-carers, three in five carers have a long-term
health condition. This is frequently exacerbated by carers being unable
to find time to attend medical appointments due to their ongoing caring
responsibilities. It is essential that services and systems are flexible
to allow carers to balance their own needs with their caring role.
Arrangements should be in place for providing increased assistance as
carers age or become less able to care. Social and health care services
should synchronise their support in order to improve carers well-being
.
- National data shows that 72% of carers live with mental ill health.
61% experience physical ill health associated with their caring
responsibilities. 23% of carers reported refusing health and care
support due to concerns over the quality and appropriateness of the
services. In addition, carers are more likely to postpone their own
medical treatments because they prioritise the needs of others .
- Older carers often have their own disabilities or long-term health
conditions. Some older people become visible to social care and
hospitals at the point of crisis – i.e., when their unpaid carer can no
longer cope with their needs .
- The Wandsworth 2011 Census shows 24.6% of carers say their health is
fair, bad, or very bad compared to 11.4% who are not providers of care
.
- The risk of poor health increases with the number of hours of unpaid
caring, 18.7% of those who do 1–19 hours per week, and 40.6% of those
who do 50+ hours per week .
- The risk of poor health also increases with age.
- 48% of carers aged 65+ reported having fair, bad or very bad health
compared to 22% of carers aged 25 to 64 .
- 37% of carers in Wandsworth have had to see a GP for health issues
relating to their caring duties in the past 12 months .
- 4.7% of carers in Wandsworth reported their caring responsibilities
had no effect on their health. This is slightly lower than other South
London Boroughs, an average of 5.9% .
- Where carers are the parents of the cared for person, there is an
increasing likelihood that their child will outlive their parent’s
ability to provide care and support.
Employment / Income / Cost of Living
Work has an important role in promoting and protecting mental
well-being. It is an important determinant of self-esteem and identity.
It also provides a sense of fulfilment and opportunities for social
interaction, and income. However, without adequate support, working and
caring together can have a considerable detrimental impact on health and
well-being. Carers working full-time and providing 50 hours or more
unpaid care per week are 2.4 times (men) and 2.7 times (women) more
likely to report their health as ‘not good’ .
There are 4.27 million carers of working age living in the UK. The
employment rate for carers is 67% and over half of those who are not
working say they would like to do so. One in eight workers is a carer.
One in three carers gives up employment because of their caring
responsibilities. A further one in six reduced their hours of work to
continue their caring role. In addition, it may be more difficult to
return to work for carers after a period of unemployment .
Over half of carers have had to borrow money due to their caring
responsibilities. Of these, three out of five have borrowed from friends
or family, others have used overdrafts. Three in every five carers have
used their savings to cover the cost of caring, and nearly one in four
have re-mortgaged or downsized their property .
Social Cohesion
Social cohesion refers to the strength of community relationships,
levels of participation in community activities, and public affairs. It
also refers to social contacts and networks (family, friends, and
relatives), social support, and a sense of belonging. Evidence shows
that higher levels of social cohesion are associated with better levels
of health including mental health and well-being, as well as other
social and economic benefits. This can be particularly important for
carers who are at risk of social isolation.
Carers often experience feelings of isolation and resentment. They
can become disconnected from friends and families, and carers are
unlikely to have the time to socialize or enjoy their own hobbies.
Research also suggests being a carer can influence the ability to
participate in social activities. In Wandsworth 17% of carers in contact
with social services report having as much social contact as they want,
while 28% report they have little social contact and feel socially
isolated .
Carers Receiving Services and Support
There were over 1,100 carers known to Wandsworth Adult Social Care
Services in December 2019, and over 4,700 known to the Carers Centre,
the table below.
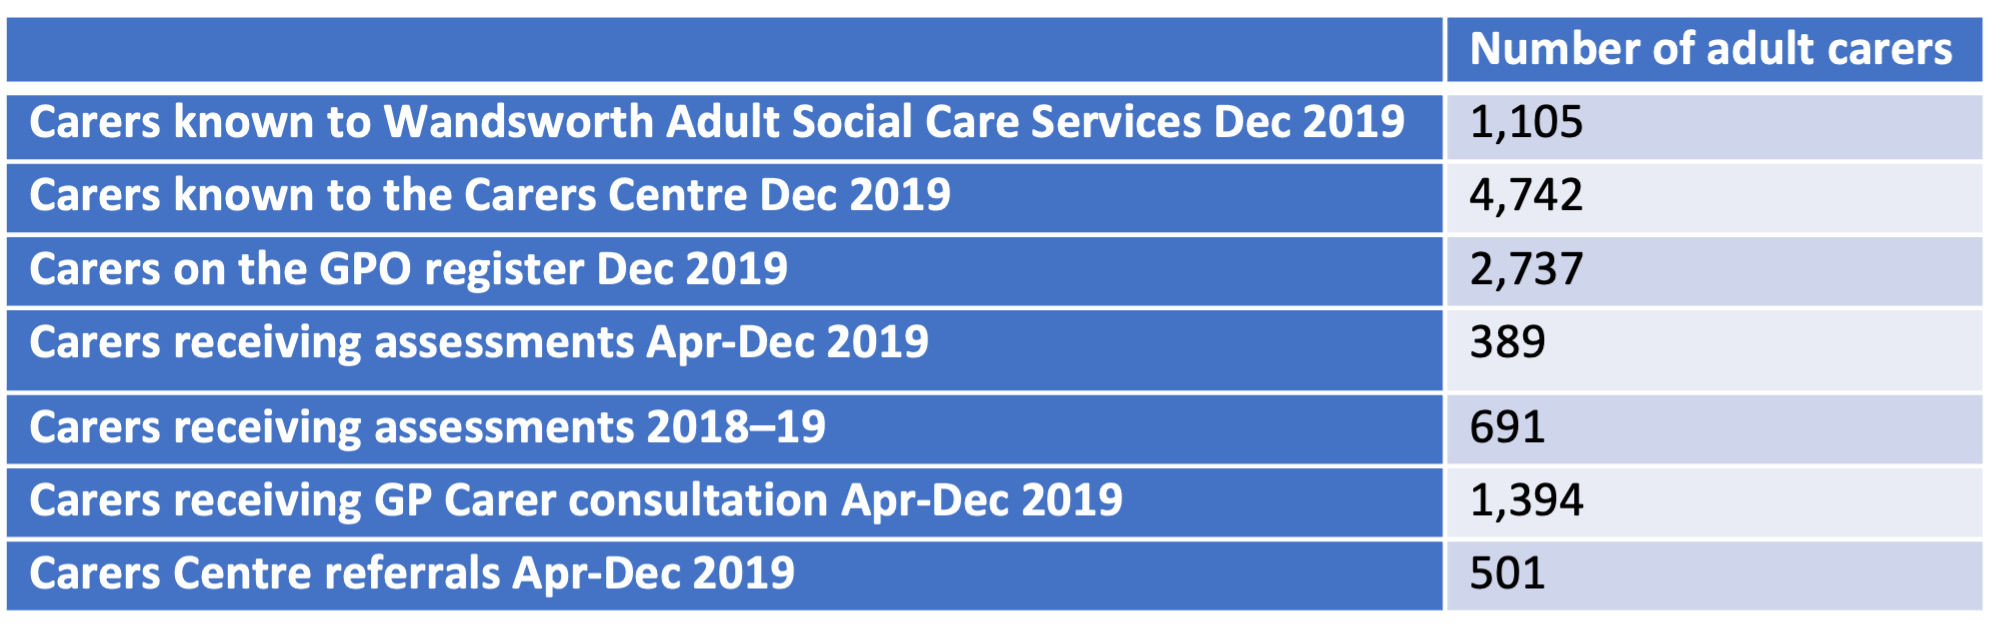
Known Wandsworth carers
Source: Internal figures
An increasing number of residents with caring responsibilities are
choosing not to register with the services. In preference, they “dip in
and out” when support is required. This reflects one of the challenges
noted earlier – many people with caring responsibilities do not
recognise themselves as carers or choose not to be labelled as a
carer.
COVID-19
The pandemic is on-going, the full impact is not yet known. However,
there is some evidence unpaid carers have been affected significantly by
COVID-19.
There has been an increase in the number of people providing unpaid
care. Evidence suggests that an extra 4.5 million people in the UK have
been providing unpaid care during the pandemic, bringing the total
number of unpaid carers to 13.6 million, an increase of 50% .
During the pandemic, day and evening services have been closed and
other services have been reduced. This has meant that many unpaid carers
have been left without support channels, having to take on more caring
responsibilities. On average carers have had to undertake an additional
10 hours of caring activity a week .
Deprivation
The percentage of residents who provide unpaid care is associated
with deprivation. Wandsworth has pockets of deprivation and pockets of
affluence. Some areas are amongst the least and most deprived in the
country (the figure below).
Southfields, Thamesfield and Northcote, have areas counted in the
least deprived (20%) of the country. Latchmere has areas that are
amongst the most deprived. Level of carer need is, therefore, likely to
be higher in these more deprived areas compared with more affluent
areas. There are carers living throughout the Borough but the highest
proportion of the population who are carers are living in West Putney
and Furzedown. There are also families and individuals throughout other
parts of the Borough who are experiencing above average levels of
deprivation and greater needs .
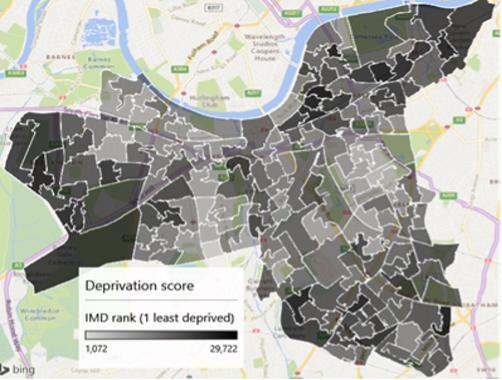
Deprivation in Wandsworth
Source: IMD, 2019
4.4 Cared for Person
Nationally, according to the Survey of Carers in Households, the most
common conditions amongst people that are looked after by unpaid carers
include :
- physical disability (58%),
- sight or hearing loss (20%),
- mental health problems (13%),
- learning disability (11%)
- dementia (10%).
The conditions of cared for people often dictate the types and
duration of caring activities.
This breakdown does not fully represent all the care requirements.
Autism spectrum disorder is included within the category of learning
disability, despite those with autism requiring significantly different
care and support than others within this group. There is no category for
those with multiple long-term conditions, they would be included in the
category of their most debilitating condition.
The absence of a specific statistical breakdown for conditions such
as autism, or for those with multiple morbidities, has implications for
the commissioning and delivery of services tailored to individuals’
requirements.
Most carers provide care for older people. In 2020, 10% of Wandsworth
residents were aged over 65 years. A vast majority of older people live
in the community, (96.6% were aged 65 years,93.7% aged 75 years and over
,ONS, 2011). The percentage of people over 65 years in Wandsworth is
projected to increase to 14% in 2050 .
4.5 Limitations to the Data
The true prevalence of caring can only be estimated due to the
invisibility of some carers within communities. A proportion of carers
will not identify themselves as a carer as they see themselves as simply
completing their duties. Groups where identification is low includes
parents and sandwich carers. Young carers may be reluctant to identify
themselves for fear of repercussions.
There are gaps in the understanding of the needs of carers of
autistic people and co-morbidities, and those carers who are in
employment. Further development of the assessment process should include
how to manage expectations and how to improve access to universal
support services.
4.6 Current Services
Carers Partnership Wandsworth is the main provider of local carer
support services. It is made up of four partners who work together, and
with other agencies, to provide high quality services.
The four partners are:
- Wandsworth Carers Centre
- Alzheimer’s Society (SW London Branch)
- Bluebird Care Wandsworth
- Carer Representatives.
The services provided include:
- Information, advice, and advocacy
- Peer support
- Carer’s respite
- Back care and therapies
- Health and social care liaison and training.
Young carers (children and young adults) have the same right as other
children to enjoy life as fully as possible. Young carers may have
different needs to other carers. Specific services for this group in
Wandsworth include:
- Carers Trust
- Children’s Society
- Youth Legal.
In addition, other services that can benefit carers, especially those
struggling to balance their own needs with their caring role,
include:
GP surgeries
- annual carers consultation
- a register of all patients identified as carer
- referrals to Wandsworth Carers Centre
- annual flu vaccinations for all registered carers
Community pharmacies
Dental practices
Special Care Dental Service is available for adults and children
with complex needs who have difficulty in getting treatments in a local
dental practice for reasons other than cost
Community health services
- complex case management
- facilitating independence
- scheduled and ongoing care
- specialist input
Wandsworth Well-being Hub
- Advice and support for ongoing conditions.
The Carer Assessment Process enables people to move between services.
A personal improvement plan is created to increase the number
assessments, address key requirements, ,manage expectations, and record
objectives and outcomes. In addition, training on best practice and
legal requirements relating to carer assessments is available.
Current young carer recording mechanisms are not synchronised and
fail to indicate the total number of young carers through the Single
Point of Access (SPA) scheme. Therefore, a review of the systems and
pathways for young carers is being conducted to improve the
identification of young carers.
Planning for the expected increase in carers will be a Wandsworth
priority.
Social Isolation
Evidence reveals that high-quality friendships are associated with better physical health and lower risk of early mortality. A lack of social interactions can increase the likelihood of high blood pressure, heart disease, obesity, weakened immune system, anxiety, depression and cognitive decline. A recent survey stated that 45% of people with a learning disability felt they did not spend enough time with friends, with 18% feeling alone and cut off from other people 65.
People with a learning disability may have limited opportunities for inclusion to a variety of social groups and may be limited by availability of services or carer preferences.
In some communities there are low levels of awareness and understanding from the general public who may not involve and value people with a learning disability.
Many people with a learning disability aspire to having a loving relationship. However, only 3% of people with a learning disability live as a couple compared to 70% of the general adult population. Support workers and family members can play an influential role in either supporting or preventing people developing and sustaining these relationships