JSNA Start Well

1. Introduction

Our earliest experiences of life, starting in the womb, through pregnancy and birth and into our early years, are vital in laying the foundations for our future health and well-being. Research consistently shows that even short-term improvements in physical, cognitive, behavioural, social and emotional development can lead to benefits throughout childhood and later life.

The Marmot Review, Fair Society, Healthy Lives identified giving every child the best start as the highest priority in reducing the inequalities gap that exists between different groups of people. Action to reduce health inequalities needs to start before birth and be followed through the life of the child to improve adult health outcomes. The Healthy Child Programme, concentrated on pregnancy and the first five years of life, sets out an integrated approach to improving the health and well-being of children and supporting families, and sets out recommended standards for service delivery 1. Improving health and well-being outcomes and reducing health inequalities is a major focus for interventions around pregnancy and maternal health, early years, and children and young people in Wandsworth.

1.1 Key Demographics and Need

  • In Wandsworth 17.4% (n=57,783) of the total population are under 18 in 2023, with a third of all households containing children 2.

  • The population of 0–17-year-olds is projected to decrease by 9.6% by 2041 (from 57,783 in 2021 to 52,257 in 2041) 3.

  • 17.2% of children aged under 16 years live in poverty in Wandsworth, 4.1/1000 families are classed as homeless which is worse than both London and England.

  • In 2020, 45% of children and young people in Wandsworth were from a Black Asian and Minority Ethnic.

  • Black Asian and Minority Ethnic groups are often disproportionately affected by poor health outcomes across a number of domains related to deprivation, language (English as a first language), housing and health inequalities.

  • In 2018, there was a higher proportion of children with special needs attending Wandsworth schools (17.3%, n=5,821) compared with the rest of London (14.4%), and England (14.4%).

  • Educational attainment overall in Wandsworth is better than average. However, the achievement of some groups is well below the average. For instance, 76.3% of children have reached a good level of development by the end of Reception, but the equivalent figure for children on free school meals is 59.9% (broadly similar to the England average for this group).

1.2 Indicators of Health and Well-being

  • Indicators of population health and well-being among children and young people in Wandsworth are either better or similar to the England average. The infant and child mortality rate is an indicative measure of overall health and in Wandsworth this rate fares well (infant 1.9/1000, child 7.8/100,000 population) against London (infant 3.9/1000, child 9.8/100,000 population) and national averages, England (infant 3.9/1000, child 10.3/100,000 population)

  • The prevalence of obesity also increases more than two-fold between Reception (9.8%) and Year 6 (22.3%) (2021/22). Levels at Year 6 are better than London (25.8%) and national (23.4%) averages.

  • Less than 95% (the minimum recommended coverage level) of children have received their first dose of all key childood immunisations, including mumps, measles and rubella (MMR). By the age of five, only 87.5% of children have received their second dose of the MMR vaccine.

  • The percentage of school pupils with social, emotional, and mental health needs in Wandsworth at 3.9% was higher than both London and England levels (2.7% and 3.0% respectively).

2. Population

2.1 Demographics

For latest demographic information please go to the population explorer on DataWand.

Under 18s Population Pyramid

In Wandsworth in 2024, 17.0% (n=56,945) of the total population are under 18 years old. The proportion of children in the borough is 17.3% lower than the London average of 20.6%.

The population of 0–17 year olds is projected to decrease by 9.6% by 2041 (from 57,783 in 2021 to 52,257 in 2041).

Source: © GLA 2021-based demographic projections. Housing-led population projections. Past Delivery 10-year migration, 2023

Under 18s Ethnicity Breakdown

In Wandsworth in 2024, 45.3% (n=30,958) of the total population aged under 18 were from BAME ethnic groups. The proportion of children from BAME ethnic groups in the borough is 20.8% lower than the London average of 57.2%.

Source: © GLA 2016-based Demographic Projections, 2017

2.2 Childhood Mortality Rates

Infant Mortality

Comparing local indicators with England averages, the health and well-being of children in Wandsworth is better than England. The infant mortality rate is better than England, but an average of 11 infants die before the age of 1 each year.

Infant mortality is an indicator of the general health of an entire population. It reflects the relationship between the causes of infant mortality and upstream determinants of population health such as economic, social, and environmental conditions. Deaths occurring during the first 28 days of life (the neonatal period) in particular, are considered to reflect the health and care of both mother and new-born.

Infant mortality rate: In 2020 - 22, Wandsworth’s rate was 1.9 per 1,000 (n=23), which was the lowest in London, 52.4% lower than the England average and 46.1% lower than the London average. The latest Borough figure for 2020 - 22 was also 46.2% lower than in 2001 - 03, in comparison with 26.5% decrease in England’s rate in the equivalent time period.

Source: OHID: Public Health Profiles

Source: OHID: Public Health Profiles

Mortality in 1-17 year olds

Child mortality rate (1-17 years): In 2020 - 22, Wandsworth’s rate was 10.5 per 100,000 (n=17), which was the 10th highest in London, 0.9% higher than the England average and 13.1% higher than the London average. The latest Borough figure for 2020 - 22 was also 3.5% higher than in 2010 - 12, in comparison with 16.7% decrease in England’s rate in the equivalent time period.

Source: OHID: Public Health Profiles

Source: OHID: Public Health Profiles

2.3 Education of School Aged Children

Learning ensures that children develop the knowledge, understanding, skills, capabilities, and the attributes they need for mental, emotional, social and physical well-being now and in the future. Access to a good education increases the prosperity of young people in the type and level of employment they can secure as they enter adulthood. Children affected by emotional disorders are more likely to have lower educational attainment, live in poverty, self-harm and be a perpetrator and/or victim of crime.

School Population

Wandsworth has 118 schools, three are state funded nurseries, 62 are state funded primaries, 11 are state funded secondaries, seven are state funded special schools, three are pupil referral units, and 32 are independent schools. The schools provide education to approximately 45,000 pupils within the borough (2020 data). 46% of pupils attended state funded primary schools, 29% attended state funded secondary schools, and 23% attended independent schools. The remainder attended state funded nursery, special schools, and pupil referral units (PRUs). A much higher proportion of local students attend independent schools compared with London 10% and England 6%4 . In Wandsworth, 91% of primary school pupils attended state funded schools which was similar to the London rate of 92%, but lower than the England rate of 96%. 72% of secondary school age pupils attend state-funded schools which was lower than the London and England rates of 79% and 91% respectively.

Source: GOV.UK. School, pupils and their characteristics. January 2020

Attainment

Educational attainment in Wandsworth is broadly higher across school phases up to and including GCSE. Table 3 shows Wandsworth’s educational attainment in comparison to the London and England averages. Average point scores at Key Stage 5 for both A Levels and applied general (a form of vocational qualification) are below national and London averages. Locally, the rate of pupil absence is lower than London and England.

  • KS4 and KS5 are teacher assessment grades in 2020

Achievement in 2019 at the Early Years Foundation Stage for those from Black, Asian and Minority Ethnic backgrounds was lower than the borough average of 76%. The Black Ethnic group had the lowest level of attainment, 10% below the borough average. Achievement for this group was also below the national average, 66% compared with a 68% nationally.

In 2020, the number of pupils attending Wandsworth state schools and independent schools with special educational needs and disabilities (SEND) was 8,000 (17.8%). This was higher than London and England rates of 15.0% and 15.4% respectively. Locally, the proportion of pupils with SEND in Wandsworth schools has remained around 13% of the school population. The borough rates have been higher than the London and England rates since 2014. Wandsworth is the 4th highest borough nationally where pupils with SEND are attending Wandsworth schools but live in other local authorities (34.4%).

Variations also exist between datasets in terms of the categorisation of needs, consideration of primary or multiple needs, and when known to multiple services. This can make it difficult to map trends in access to and provision of services across the population of children and young people. Furthermore, care is required when interpreting data to ensure that a consistent population is used for comparison.

Local authorities do not have a remit to record any attainment or destination data for young people who are home educated meaning comparisons with mainstream school performance measures cannot be discerned. Wandsworth is working towards establishing a dataset for understanding the post-16 destinations of Elective Home Educated (EHE) children.

2.4 Child Poverty

The Marmot Review (2010) suggests there is evidence that childhood poverty leads to premature mortality and poorer health outcomes for adults. There is also a wide variety of evidence to show that children who live in poverty are exposed to a range of risks that can have a serious impact on their mental health. Reducing the number of children who experience poverty should improve their health outcomes in adulthood and increase their healthy life expectancy.

Children in Low Income Families

The level of child poverty in Wandsworth is similar to England, with 17.2% (8465) of children aged under 16 years living in low-income families 4.

Children in absolute low income families (under 16s): Absolute low income is defined as a family in low income Before Housing Costs (BHC) in the reference year in comparison with incomes in 2010 to 2011. A family must have claimed one or more of Universal Credit, Tax Credits or Housing Benefit at any point in the year to be classed as low income in these statistics.

Absolute low income takes the 60 percent of median income threshold from 2010 to 2011 and then fixes this in real terms (i.e. the line moves with inflation). This is designed to assess how low incomes are faring with reference to inflation. It measures the number and proportion of individuals who have incomes below this threshold. The percentage of individuals in absolute low income will decrease if individuals with lower incomes see their incomes rise by more than inflation.

In 2022/23, Wandsworth’s rate was 9.7% (n=5151), which was the 8th lowest in London, 37.8% lower than the England average and 21.1% lower than the London average. The latest Borough figure for 2022/23 was also 9.0% higher than in 2014/15, in comparison with 1.3% increase in England’s rate in the equivalent time period.

Source: OHID: Public Health Profiles

Source: OHID: Public Health Profiles

Free School Meals

In Wandsworth in 2019 there were 6,072 pupils, including those attending special schools, pupil referral units and local authority alternative provision, known to be eligible and claiming free school meals (FSM). Among those attending state funded schools, 24.3% (n=64) of nursery pupils, 17.2% (n=3,570) of primary school pupils and 16.6% (n=2,093) of secondary school pupils were eligible for and claiming FSM. A much higher proportion of nursery school pupils claim FSM (24.3%), in comparison to London (10%), inner London (12.7%) and England (6.6%).

The number of children known to be eligible for FSM is frequently used as an indicator or poverty. In Wandsworth, 19.6% (6,761) of pupils, including those attending special schools, pupil referral units, and local authority alternative provision, were known to be eligible for and claiming FSM in January 2020. This was similar to the London average of 18.8% but below the England figure of 17.3%. This has increased in each of the last two years. Of those attending state funded schools 25.9% (n=58) of nursery pupils, 19.2% (n=3,922) of primary school pupils, and 18.5% (n=2,400) of secondary school pupils were eligible for and claiming FSM. A much higher proportion of state-funded nursery school pupils claim FSM locally (25.9%) compared to London (10.1%), and England (6.7%) 5.

Children on FSM achieving a good level of development at Reception is much lower at 60% and, while improvements have been made since 2012/13, there are early signs that these improvements are beginning to decline.

The number of children known to be eligible for free school meals is frequently used as an indicator or poverty.

Free school meals: % eligible: In 2022/23, Wandsworth’s rate was 27.8% (n=9236), which was the 14th highest in London, 16.6% higher than the England average and 7.6% higher than the London average. The latest Borough figure for 2022/23 was also 10.4% higher than in 2011/12, in comparison with 41.4% increase in England’s rate in the equivalent time period.

Source: OHID: Public Health Profiles

Source: OHID: Public Health Profiles

3. Prenatal and Postnatal Health

Many of the health behaviours and risk factors for poor birth outcomes are established prior to pregnancy. Often there is limited potential to impact on these after conception (the start of pregnancy) 6. For example, 13.7% of adult women smoke and whilst few, if any, take up smoking as a new behaviour while pregnant, in the UK 11% of women are still smoking through to the birth of their baby.

3.1 Healthy Behaviours in Pregnancy

A mix of health-related behaviours, reducing risk factors, and supporting women to alleviate the negative impact of the wider determinants on their health, will enable them to have a healthy pregnancy. Even among those who do plan their pregnancy, relatively few will modify their behaviours 7.

Healthy behaviours include a healthy diet (including folic acid supplements), regular physical activity, and emotional well-being. It is important immunisations, sexual health checks, and smear tests are up to date.

Pre-conception risk factors include smoking, alcohol, substance misuse, obesity, long term physical and mental health conditions, previous pregnancy complications, genetic risks, maternal age, adverse childhood experiences (ACEs), domestic violence, and migrant health factors 8 and these will often be interlinked.

Furthermore, the wider determinants of health such as housing, education and skills, financial security, work, and family relationships also influence pre-conception health. The impacts of these are unequally distributed meaning those with the greatest need may have the most difficulty accessing care. Many of these issues are covered across the whole of the JSNA and will be referenced elsewhere. Only a snapshot of health behaviours and risks factors for Wandsworth will be covered in this chapter.

Women who are overweight or obese before pregnancy have increased risk of infertility. They may also be complications during pregnancy and birth including impaired glucose tolerance/gestational diabetes, miscarriage, preeclampsia, thromboembolism, and maternal death. Babies born to obese women have a higher risk of foetal death, stillbirth, congenital abnormality, shoulder dystocia, macrosomia, and subsequent obesity. In 2016/17 over 55% of women were overweight or obese in England and the prevalence of overweight and obese adults is predicted to reach 70% by 2034.

Some pre-existing conditions such as epilepsy or severe mental illness can be a risk factor for maternal deaths either within pregnancy or for up to a year after the end of the pregnancy. Maternal suicide 9 remains the leading direct cause of maternal deaths. Nationally 1 in 7 women die in the period between six weeks and one year after pregnancy by suicide. Nationally, an estimated 20% of women will develop a mental illness during pregnancy or within the first year after having a baby. It is estimated in Wandsworth that during this time :

  • 358 to 537 women will develop mild to moderate depressive illness and anxiety
  • approximately 537 to 1073 women will develop adjustment disorders and distress
  • 107 women will have post-traumatic stress disorder
  • 107 women will have a severe depressive illness
  • 7 women will be living with a chronic serious mental illness
  • 4 women will be affected by postpartum psychosis.

Maternal age is a factor that can influence both pregnancy and childhood outcomes. Teenage pregnancy is associated with a higher risk of late antenatal booking, lower birth weight babies, stillbirth, and infant mortality. The rate of under-18 years conceptions in Wandsworth has seen a substantial reduction over the last decade and has fallen more steeply than those across England 10. The latest data for 2021 shows that in England 13.1/1,000 young women under-18 years became pregnant.

Births to women aged 35 years and over also carry additional risks in relation to birth complications, congenital abnormalities, stillbirth, and emergency sections. However, the exact age at which these risks increase is uncertain and co-existence of additional risk factors e.g., smoking, will increase the chance of adverse birth outcomes. The latest Office of National Statistics (ONS) conception data released in 2021 indicates that between 2011 and 2021, women aged 35 to 39 years and aged 40 years and over, were the only age groups to see an overall increase in conception rates. Since 2011, the conception rates have increased by 3.5% for women aged 35 to 39 years and 19.7% for women aged over 40 years 11. Nationally, women are progressively delaying childbearing until older ages. The latest available data shows that 8% of births in Wandsworth were to women aged 40+, which ranks the seventh highest in London and is above the England percentage of 4.4%.

Trends in outcomes for new-borns may reflect the higher maternal age in Wandsworth:

  • the percentage of births delivered by caesarean section are statistically similar at 28.3% for women in Wandsworth and across England at 27.1%, and has increased minimally since 2014
  • the stillbirth and neonatal mortality rate at 5.7/1000 live births is statistically similar to England at 6.9/1000, with no discernible increase or decrease in trends
  • while low birth weights of babies are higher than the England average, very low birth weight of all babies at 0.93% is statistically similar to England at 1.14%, with no discernible increase or decrease in trends
  • the premature birth rate (births at less than 37 weeks) at 69.5/1000 live births is statistically better than England at 81.2/1000 births, with no discernible increase or decrease in trends.

3.2 Smoking in Pregnancy

Smoking is the single biggest modifiable risk factor for poor birth outcomes. Smoking during pregnancy causes up to 2,200 premature births, 5,000 miscarriages and 300 perinatal deaths every year in the UK. It also increases the risk of stillbirth, complications in pregnancy, low birthweight, and of the child developing other conditions in later life. Currently 13.7% of adult women in the UK smoke cigarettes and nearly 11% of women in England are still recorded as smoking at the time of delivery.

Smoking in Early Pregnancy

Smoking in early pregnancy: In 2018/19, Wandsworth’s rate was 3.1%, which was the 3rd lowest in London, 75.9% lower than the England average and 48.9% lower than the London average. Time series data were not available for this indicator.

Source: OHID: Public Health Profiles

Smoking in Late Pregnancy

Smoking status at time of delivery: In 2022/23, Wandsworth’s rate was 5.2% (n=159), which was the 8th highest in London, 40.9% lower than the England average and 13.0% higher than the London average. The latest Borough figure for 2022/23 was also 18.3% higher than in 2010/11, in comparison with 35.5% decrease in England’s rate in the equivalent time period.

Source: OHID: Public Health Profiles

Source: OHID: Public Health Profiles

3.3 Low Birthweight

Low birthweight (under 2.5kg) is one of the known risk factors for infant deaths.

Low birth weight of term babies: In 2021, Wandsworth’s rate was 2.8% (n=106), which was the 11th lowest in London, 1.3% higher than the England average and 14.7% lower than the London average. The latest Borough figure for 2021 was also 36.3% higher than in 2006, in comparison with 8.1% decrease in England’s rate in the equivalent time period.

Source: OHID: Public Health Profiles

Source: OHID: Public Health Profiles

3.4 Breastfeeding

The first 1001 days mark the moment of conception through to a child’s second birthday and have been found to be crucial for laying the foundations for future development and preventing illness in later life.

Ensuring every child has the best start in life is a national and a local priority. Initiating breastfeeding from birth is one of the earliest interventions that can give a child the best possible start, can lay the foundations for future development, and prevent illness in later life. Initial breastfeeding uptake 12 in Wandsworth has seen increases in recent years, and currently stands at 86.7%, which is the third highest in London. Whilst this is encouraging, the child poverty indicators suggest that more needs to be done to ensure early health gains are sustained as children develop.

The World Health Organisation (WHO) and the United Nations International Children’s Emergency Fund (UNICEF) recommend breastfeeding to be initiated within the first hour after birth and continued exclusively for the first six months and beyond with safe weaning onto solids foods. The UK, however, has one of the lowest breastfeeding rates in the world. There is limited breastfeeding data available to compare trends particularly due to the different timescales for data collection internationally.

An analysis of global breastfeeding prevalence in 2016 found that only 34% of babies in the UK were receiving breastfeeding at six months compared with 49% in the US, and 71% in Norway 13. Additionally, a study based on 73 countries between 2010–2017 on breastfeeding at 2 years showed the length of time a mother breastfed was associated with the socioeconomic status of the household. Furthermore, 64% of babies in poor families were still breastfeeding at two years, in line with WHO recommendations, when compared with 41% of babies from the richest families. The gap was widest in West and Central Africa with 63% of babies from the poorest families breastfeeding at two years of age. In Eastern Europe and Central Asia between the wealthiest and poorest families there were low rates of breastfeeding at 2yrs at 23% for the wealthiest families and 31% for the poorest 14.

There are multiple explanations for these low breastfeeding rates. Sometimes mothers experience practical problems when establishing breastfeeding and fail to receive adequate practical support. There are additional concerns about whether a child is receiving sufficient milk, and is often due to advice from friends, family and professionals to supplement with formula milk. This reduces breastmilk production and is strongly associated with premature cessation of breastfeeding 15. Anecdotal evidence reveals that social attitudes about women breastfeeding in public may lead to women feeling uncomfortable about breastfeeding.

In light of these low figures, there are several policy drivers in the UK promoting breastfeeding which include (but are not limited to):

  • Healthy Child Programme 2009 – pregnancy & the first 5 years of life
  • UNICEF Baby Friendly Initiative
  • Public Health Outcomes Framework
  • Public Service Agreements (PSA) targets such as reducing infant mortality rate & preventable infections, reducing hospital admissions in infancy, and reducing childhood obesity.

Increasing the number of babies breastfed ensures they have the best possible start with significant health benefits for both mother and baby. For the baby this includes protection against illness and infection, prevention of diarrhoea and respiratory infections, reduced risk of sudden infant death syndrome (SIDS), and risk of breast cancer, postnatal depression, and ovarian cancer for the mother 16.

Breastfed children also perform well on intelligence tests and are less prone to diabetes in later life. There is also growing evidence to suggesting an increased future risk of childhood obesity in those who have not been breastfed. In addition to the health benefits of breastfeeding, a cost/benefit analysis carried out by UNICEF, indicates increasing the number of babies who are breastfed will help save the NHS up to £50 million each year 17 thereby reducing financial pressure on both local and national resources.

Breastfeeding Rates

Baby’s first fed breastmilk is defined as the percentage of babies whose first feed is breastmilk which includes expressed and donor milk. This first fed breastmilk is important for two reasons:

  • the establishment and continuation of breastfeeding begins with initiation and first feed
  • the feeding of colostrum in the first hours and days of life confers protective benefits.

Colostrum contains several concentrated properties which provide a protective coating to the lining of the gut preventing bacterial transfer. The percentage of babies first fed breast milk in Wandsworth is among the top three boroughs in London, higher than London and England averages.

Baby’s first feed breastmilk (previous method): In 2018/19, Wandsworth’s rate was 86.7% (n=3615), which was the 3rd highest in London, 28.7% higher than the England average and 13.6% higher than the London average. The latest Borough figure for 2018/19 was also 9.7% higher than in 2017/18, in comparison with nan% increase in England’s rate in the equivalent time period.

Source: OHID: Public Health Profiles

Source: OHID: Public Health Profiles

Breastfeeding initiation (within the first 48 hours of birth) and uptake at 6–8 weeks are included in the National Institute for Health and Clinical Excellence (NICE) proposals for the Commissioning Outcomes Framework.

Breastfeeding prevalence at 6–8weeks is defined as the percentage of infants that are totally or partially breastfed at age 6–8 weeks.

Table below shows that Wandsworth has seen an overall improvement in 6–8 week prevalence rates between 2018 to 2019 from 26% in quarter 1 to 79% in quarter 4. The overall total for the year is 56%, higher than the England average. Breastfeeding prevalence at 6–8 weeks for Wandsworth in quarter 1 and quarter 2 was lower than the England average. However, this was due to a change in systems nationally and locally resulting in staff recording errors which have now been resolved.

Source: England data source 18 CLCH 19 for Wandsworth

Since April 2003, data on the local breastfeeding prevalence at 6–8 weeks has been requested on a quarterly basis. Historically this was obtained from all Primary Care Trust (PCTs), via the Department of Health (DH), Integrated Performance Monitoring Returns. Between April 2013 and September 2015 data was collected directly from providers via the data collection tool that is part of Unify2, a web-based system set up to collect performance and other central returns directly from the NHS. From October 2015 the breastfeeding data set has been obtained from the health visiting service at a local authority level. There is a national programme to strengthen the breastfeeding data collection system to ensure accuracy and timeliness of data submission.

Breastfeeding coverage is defined as the percentage of maternities for whom breastfeeding initiation status is recorded. For breastfeeding prevalence data to meet statistical requirements and be validated, the coverage for both initiation and 6–8 weeks must be at least 95% 20. Wandsworth has not met this target and for this reason these indicators have not been updated for a few years nationally. Going forward, Wandsworth will have regular local data allowing to monitor trends in breastfeeding rates.

There are a range of breastfeeding services on offer in the community and in the hospital. Public Health Wandsworth, commission Central London Community Healthcare Trust (CLCH) to provide the Health Visiting Service for Wandsworth’s young adults. This includes providing evidenced pathways for delivering each of the 6 High Impact Areas to all levels of family need. The High Impact Areas are part of the 4-5-6 Model which provides an evidence-based framework through which health visitors can maximise their contribution was leaders of the Healthy Child Programme.

Breastfeeding support for Wandsworth is provided by the Health Visiting Service and supported by infant feeding leads in hospital and in the community:

  • Hospital: Women receive breastfeeding support from the day of their child’s birth, if they choose to breast feed, until around day 10 – 28 days. The handover of support to the Health Visiting Service commences from day 10 after birth. The midwives in the hospital are trained to provide baby-friendly standard care by the Infant Feeding Team. Additionally, St George’s Hospital have a Breastfeeding Peer Support Scheme, which includes Breastfeeding Peer Supporters, who support the midwives to provide mothers with breastfeeding support where needed. This team is managed by the hospital’s Infant Feeding Lead.

  • Community: The community infant feeding lead delivers training for the health visitors, who provide breastfeeding support to mothers when they are discharged from the Community Midwife Team, usually between 10 to 14 days after the birth. Breastfeeding Support Clinics are available around the borough to support mothers as needed and they are led by the Health Team’ made up of health visitors, nursery nurses and lactation consultants. Additionally, there are voluntary independent organisations that run Breastfeeding Support Groups within the Borough led by La Leche League Leaders and Nation Child Trust (NCT) breastfeeding counsellors.

Wandsworth Council has a Breastfeeding Operational Group chaired by the Public Health Children and Young People Lead. Members of the group include the infant feeding leads for both the hospital and community, breastfeeding lactation consultants from the voluntary sectors, health visitors and Children’s Services.

Wandsworth Health Visiting Service currently has Level 1 UNICEF Baby Friendly Initiative Accreditation. Central London Community Healthcare is currently going for Level 2 status. A key element of this is supporting families with feeding and ensuring all children get the best start in life. Whenever possible this is supporting breastfeeding and appropriate formula feeding where necessary.

Wandsworth has a Breastfeeding Welcome Scheme that encourages businesses and organisations to display posters to support mothers to breastfeed on their premises.

UNICEF Baby Friendly Initiative Accreditation

UNICEF Baby Friendly Accreditation is an evidence based, staged accreditation programme that supports Maternity, Neonatal, Health Visiting and Children’s Centre Services to deliver effective breastfeeding support. It is a nationally recognised mark of quality care for babies and mothers. In Wandsworth the Infant Feeding Leads for both the community and the hospital (St George’s Maternity) lead on this programme. To date the hospital has achieved Level 3 (full accreditation) and is in the process of reaccreditation to maintain full accreditation status of the programme. The community service has just been assessed for Level 2 and are awaiting final results. While this was due to commence during 2020 all accreditation programmes were paused due to COVID-19. Reassessment for Stage 2 is now planned for the end of 2021 with the view to achieving Baby Friendly Initiative stage 3 accreditation by the end of 2022.

UNICEF Baby Friendly Initiative

Source: UNICEF UK. Baby Friendly Initiative. 2020 (redesigned internally)

There are a range of evidence-based approaches to promoting breastfeeding in the UK. Some of these have been implemented in Wandsworth. There is overwhelming evidence that shows breastfeeding saves lives. “Breastfeeding practices are highly responsive to interventions delivered in health systems, communities and homes. The largest effects are achieved when interventions are delivered in combination” (Lancet Breastfeeding Series, 2016).

Public Health in Wandsworth is working with the National Childbirth Trust to create baby friendly places that promote breastfeeding in public space. The programme includes the development of resources (posters, stickers, leaflets) for local businesses, GPs, libraries, and other community settings to support their commitment to promote breastfeeding in their settings. Promotional material provides mothers with information on breastfeeding friendly places across the borough. Discussions are also in place to develop a ‘breastfeeding peer support service’ in the community with a timeline to achieve Level 3 (full accreditation) within 1 year of achieving Level 2 accreditation for the Peer Scheme.

Wandsworth, currently, has some of the recommended breastfeeding initiatives in place and is working towards implementing a more robust multi-faceted and evidence-based approach.

4. Antenatal and Newborn Screening

4.1 Newborn Blood Spot Screening

All babies up to, but not including, their first birthday are eligible for the Newborn Blood Spot Screening (NBSS), otherwise known as the ‘heel prick test’. The aim of the screening programme is to enable early identification, referral, and treatment of babies with nine rare but serious conditions, the last six of which are inherited metabolic diseases, including:

  • sickle cell disease
  • cystic fibrosis
  • congenital hypothyroidism
  • phenylketonuria
  • medium-chain acyl-CoA dehydrogenase deficiency
  • maple syrup urine disease
  • isovaleric acidaemia
  • glutaric aciduria type 1
  • homocystinuria.

A health professional will usually take a blood spot sample on day 5 (day of birth is day 0) from a child’s heel and send the sample for testing. Babies, who are new to the country or are yet to have a blood spot test, are eligible for testing up to one year old. Data for Wandsworth has not been available for the last four years. The latest available data for the borough was 2015/16 and the coverage or the blood spot screening was 99% of all newborns.

In 2018/19 99.4% of babies registered with Wandsworth Clinical Commissioning Group (CCG) GPs that were eligible for NBS screening had a conclusive result recorded on the Child Health Information System (CHIS) at less than or equal to 17 days of age. Furthermore, 94.4% of those who either moved in from a different CCG area in the first year of life, or moved in from another UK country or abroad, had a conclusive result recorded on the CHIS at less than or equal to 21 calendar days of notification of the CHRD.

4.2 Newborn Hearing Screening

Newborn hearing tests help to identify most babies with significant hearing loss. The hearing screening significantly reduces the risk of having undiagnosed hearing problems that can affect children’s speech and social development 21.

Newborn Hearing Screening: Coverage: In 2022/23, Wandsworth’s rate was 98.7% (n=3862), which was the 16th lowest in London, 0.2% higher than the England average and 0.1% higher than the London average. The latest Borough figure for 2022/23 was also 0.9% higher than in 2013/14, in comparison with 0.1% increase in England’s rate in the equivalent time period. Missing time series data for Wandsworth have been estimated using linear interpolation.

Source: OHID: Public Health Profiles

Source: OHID: Public Health Profiles

5. NHS Childhood Vaccination Programmes

Vaccination coverage is the best indicator of the level of protection a population will have against vaccine preventable communicable diseases. Coverage is closely correlated with levels of disease. Monitoring coverage identifies drops in levels of population immunity before the levels of disease rise.

5.1 Routine Pre-School Immunisations

Immunisations for vaccine-preventable diseases including congenital rubella syndrome, pertussis, influenza, and hepatitis B infection are an important element of protecting the health of mother and baby. Maternal rubella infection in pregnancy, for example, may result in foetal loss or congenital rubella syndrome, and influenza infection in pregnancy is associated with risks to the foetus, including stillbirth.

The complete childhood vaccination schedule covers numerous diseases. In addition to whole population vaccinations the schedule also includes additional vaccinations for at risk groups such as annual influenza for babies born to hepatitis B infected mothers, and infants in areas of the country with high tuberculosis rates. Additional vaccines are also given to individuals with underlying medical conditions. To achieve community immunity to the disease, the required coverage for the childhood vaccinations is 95% of the eligible population.

DTaP/IPV/Hib

The combined DTaP/IPV/Hib is the first in a course of vaccines offered to babies to protect them against diphtheria, pertussis (whooping cough), tetanus, haemophilus influenzae type B (an important cause of childhood meningitis and pneumonia), and polio (IPV is inactivated polio vaccine).

The vaccine is offered when babies are two, three and four months old. Monitoring coverage identifies drops in population immunity before levels of disease rise. The combined DTaP/IPV/Hib is the first in a course of vaccines offered to babies to protect them against these five diseases.

Population vaccination coverage: Dtap IPV Hib HepB (1 year old): In 2022/23, Wandsworth’s rate was 89.9% (n=3731), which was the 10th highest in London, 2.1% lower than the England average and 2.7% higher than the London average. The latest Borough figure for 2022/23 was also 1.4% lower than in 2010/11, in comparison with 2.5% decrease in England’s rate in the equivalent time period.

Source: OHID: Public Health Profiles

Source: OHID: Public Health Profiles

Population vaccination coverage: DTaP and IPV booster (5 years): In 2022/23, Wandsworth’s rate was 66.8% (n=2863), which was the 6th lowest in London, 19.8% lower than the England average and 8.1% lower than the London average. The latest Borough figure for 2022/23 was also 6.1% lower than in 2015/16, in comparison with 3.4% decrease in England’s rate in the equivalent time period.

Source: OHID: Public Health Profiles

Source: OHID: Public Health Profiles

Measles, Mumps and Rubella (MMR) vaccinations

MMR is the combined vaccine that protects against measles, mumps and rubella which are highly infectious, common conditions that can have serious complications, including meningitis, swelling of the brain (encephalitis) and deafness. They can also lead to complications in pregnancy that affect the unborn baby and can lead to miscarriage.

The first MMR vaccine is given to children as part of the routine vaccination schedule, usually within a month of their first birthday. They will then have a booster dose before starting school, which is usually between three and five years of age.

MMR vaccine coverage across London and England had been falling between 2013/14 and 2018/19 for all ages and for both doses since the previous period.

Population vaccination coverage: MMR for one dose (2 years old): In 2022/23, Wandsworth’s rate was 83.7% (n=3312), which was the 16th highest in London, 6.3% lower than the England average and 1.6% higher than the London average. The latest Borough figure for 2022/23 was also 1.6% higher than in 2010/11, in comparison with 0.2% increase in England’s rate in the equivalent time period.

Source: OHID: Public Health Profiles

Source: OHID: Public Health Profiles

Population vaccination coverage: MMR for two doses (5 years old): In 2022/23, Wandsworth’s rate was 75.2% (n=3221), which was the 15th highest in London, 11.1% lower than the England average and 1.6% higher than the London average. The latest Borough figure for 2022/23 was also 13.3% lower than in 2010/11, in comparison with 0.4% increase in England’s rate in the equivalent time period.

Source: OHID: Public Health Profiles

Source: OHID: Public Health Profiles

5.2 School Age Immunisations

Human Papillomavirus Vaccinations (HPV)

Some types of Human Papillomavirus Virus (HPV) are linked to the development of cancers, such as cervical cancer (more than 70% of these cancers are linked to HPV), anal cancer, genital cancers, and cancers of the head and neck. Two doses of HPV vaccine protect against four types of HPV: 6, 11, 16 and 18. Type 16 and 18 significantly increase the chances of developing cancer.

The 1st dose of the HPV vaccine was routinely offered to girls aged 12 and 13 years in school, with the 2nd dose offered usually within one year from the first dose. For school year 2019/20 boys and girls in Year 8 are eligible for the HPV vaccine 22.

Population vaccination coverage: HPV vaccination coverage for two doses (13 to 14 years old): In 2022/23, Wandsworth’s rate was 54.8% (n=692), which was the 16th lowest in London, 12.9% lower than the England average and 3.7% higher than the London average. The latest Borough figure for 2022/23 was also 34.6% lower than in 2015/16, in comparison with 26.1% decrease in England’s rate in the equivalent time period.

Source: OHID: Public Health Profiles

Source: OHID: Public Health Profiles

Meningococcal (MenACWY) Vaccinations

MenACWY vaccine protects against four strains of the Meningococcal bacteria – A, C, W, Y – which cause meningitis and blood poisoning (septicaemia). Children aged 13 to 15 are routinely offered the MenACWY vaccine in schools 23.

Population vaccination coverage: Meningococcal ACWY conjugate vaccine (MenACWY) (14 to 15 years): In 2021/22, Wandsworth’s rate was 78.9% (n=2069), which was the 10th highest in London, 0.8% lower than the England average and 4.8% higher than the London average. The latest Borough figure for 2021/22 was also 0.2% higher than in 2016/17, in comparison with 3.5% decrease in England’s rate in the equivalent time period.

Source: OHID: Public Health Profiles

Source: OHID: Public Health Profiles

5.3 Immunisation Rates of Looked After Children

Children in care immunisations: In 2023, Wandsworth’s rate was 62.0% (n=106), which was the 5th lowest in London, 24.4% lower than the England average and 16.6% lower than the London average. The latest Borough figure for 2023 was also 28.1% lower than in 2012, in comparison with 1.3% decrease in England’s rate in the equivalent time period.

Source: OHID: Public Health Profiles

Source: OHID: Public Health Profiles

6. 0–19 Years Services (School Nursing and Health Visiting)

A range of services exist for children and young people that promote and encourage positive health and well-being. Many are referenced in other parts of this JSNA, but for a population prevention programme section a key health related service is the 0–19 years Health Visiting and School Nursing Services.

6.1 School Nursing Service

The overarching aim of the school nursing element of the 0–19 years’ service is to develop and improve the emotional, physical, and mental well-being of children and young people. The service includes the following key components:

  • universal and specialist Public Health Services for children that promote the health and well-being of all children and reduce inequalities through targeted intervention for vulnerable and disadvantaged children aged 5-19 years, and their families
  • delivery of the Healthy Child Programme using holistic health assessment skills to establish where early intervention and preventive public health skills should be deployed
  • an important conduit between education and health services to ensure that children and their parents access appropriate medical and health support to enable children and young people to maximise their educational opportunities
  • maintain and develop a diverse set of clinical skills and/or specialities within the provider’s School Nursing Team to ensure the service can address a wide range of health needs, including the mental health and well-being needs of children and young people.

More specifically the School Nursing Service focuses on:

  • assessment and identification of the health and well-being needs of children and young people
  • offering advice, support and care that meets the needs of children and young people with the involvement of their parents and carers
  • building emotional well-being, resilience, and identifying mental health concerns at an early stage
  • preventing risky behaviours including smoking, alcohol, and drug misuse
  • providing sexual health and relationship education
  • delivering the National Child Measurement Programme in Reception and Year 6 in accordance with statutory requirements within the Health and Social Care Act 2012
  • reducing childhood obesity
  • meeting additional and complex needs with respect to mental health and disabilities, including vulnerable groups (children with Education and Healthcare Plans/SEND, Children with Child Protection Plans, Looked After Children, Children in Youth Offending Teams, Young Carers and Children in Need).

Prior to the pandemic, work had commenced to ensure the outcomes for the school nursing services were captured within key performance data to provide enhanced monitoring of the service. This work was put on hold during the pandemic following the NHS COVID-19 directives to re-focus NHS services to provide much needed increased capacity for the NHS emergency response. Some school nursing teams were re-deployed on an interim basis. Our local provider, however, retained a key focus on safeguarding while schools were closed. In March 2021 the government re-launched the Healthy Child Programme replacing the “4,5,6 model”, to focus on personalised assessments of needs and interventions to better respond to children and families’ needs across time.

The new model aims to capture the full extent of both the health visitor and school nurse offers, in recognition that local services’ provision goes beyond the five mandated contacts. The language of the “4,5,6 model” has now been removed and revised with increased opportunities for further contacts to provide additional support, especially during the early years. The model includes two additional universal contacts at 3-4 months and 6 months. This will provide important opportunities to address key public health priorities including perinatal mental health, child development, breastfeeding, childhood obesity prevention, immunisation uptake, and safe sleep.

Commissioners and public health are currently working with the provider to ensure the service meets both universal and targeted needs of children, young people, and families within the context of the ‘new normal’ alongside re-starting contract variation and Key Performance Indicators (KPI) discussions whilst embedding changes to the Healthy Child Model.

6.2 Health Visiting

The 0–19 years Health Visiting Service is commissioned to undertake interventions which result in the overall improvement of child health across Wandsworth and as such contribute to the achievement of the Child Health Measures as set out by the Department of Health and presented in table below 24.

National Measures of Child Health

This is achieved through adherence to all components of Department of Health’s 2009 Healthy Child Programme (HCP) 25 where a core universal service offer is balanced with effective and targeted responses to varying family needs, and accounts for the specific requirements of those with greater needs.

The HCP provides an evidence-based framework that identifies the necessary screening tests, immunisations, developmental reviews, information, and guidance necessary to support parenting and healthy choices to enable children to secure optimum health and well-being. Evidence shows that the HCP yields a good return on investment and that interventions are highly effective in securing healthy child development, positive future health and educational outcomes. This can reduce costs associated with dealing with problems such as mental ill-health and delayed learning, as well as child protection issues .

The 0–19 year service is currently commissioned to CLCH with the following objectives and service model:

  • improve the health and well-being of babies and children under five years and reduce inequalities in outcomes as part of an integrated multi-agency approach to supporting and empowering children and families
  • ensure a strong focus on prevention, health promotion, early identification of needs and early intervention with clear, effective plans
  • ensure the delivery of the Healthy Child Programme (HCP) to all children and families, including at each of the five mandated contacts
  • consider all adults with legal parental responsibility for the child as equal parents and fully include wherever this is practical and possible when working with families.

The revised service model, presented below, is based on the 4-5-6 Model, DoH, 2015

Healthy Child Programme

Source: OHID, Overview of the 6 early years and school aged years high impact areas (redesigned internally)

Additionally, in Wandsworth, CLCH is also commissioned to deliver the Family Nurse Partnership (FNP) which works with parents aged 24 years and under, partnering them with a specially trained family nurse who visits them regularly, from early pregnancy until their child is 2 years old. There are five contact points for the service: an antenatal contact, a home visit at 10–14 days, a home visit at 6–8 weeks, a home visit at 1 year (between 9–12 months) and a contact at 2- 2.5 years 26.

Child development: percentage of children achieving a good level of development at 2 to 2 and a half years: In 2022/23, Wandsworth’s rate was 69.7% (n=971), which was the 16th highest in London, 12.1% lower than the England average and 0.3% higher than the London average. The latest Borough figure for 2022/23 was also 20.3% lower than in 2019/20, in comparison with 4.8% decrease in England’s rate in the equivalent time period.

Source: OHID: Public Health Profiles

Source: OHID: Public Health Profiles

The latest available published data reveals that in quarter 2 2019/20, 139 women in Wandsworth received a face-to-face antenatal visit from a health visitor. Families receiving a Health Visiting Service the following was achieved:

  • 93% of all new births received a new birth visit within 14 days (of 1033 new births in the quarter)
  • 90% of infants received a 6–8 week home visits by the time they were 8 weeks old (of 1039 infants in the quarter)
  • 72% of children received a 12-month review by the time they turned 12 months (of 1138 infants turning one in the quarter) and 92% had received the review by the time they reached 15 months
  • 70% of 2 to 2½ year olds received a 2 to 2½ year review in the quarter (of 1032 infants), 100% of which used the Age and Stages Questionnaire (ASQ).

6.3 Healthy Early Years Award Case Study

Healthy Early Years London (HEYL) is an awards scheme funded by the Mayor of London for all early year’s settings and childminders. It supports and recognises achievements in child health, well-being, and development. The HEYL Award builds on the success of Healthy Schools London and compliments the statutory Early Years Foundation Stage Framework, adding to the focus on children, families and staff, health, and well-being. The award is focused on a whole setting approach by involving children, parents, and the local community to create a healthy learning environment across 12 themes including:

  1. Healthy eating

  2. Breastfeeding and starting solid foods

  3. Oral health

  4. Physical activity

  5. Physical development

  6. Reducing sedentary behaviour

  7. Speech, language and communication

  8. Early cognitive development

  9. Social and emotional well-being

  10. Parenting and home learning

  11. Home safety

  12. Accident prevention and reducing injuries.

It is recognised by Ofsted as it is based on three Ofsted judgments and supports the Mayor of London’s upcoming ‘Better Health for Londoners Health Inequalities Strategy’. It aims to tackle health inequalities across the capital at the earliest opportunity in a child’s life.

The HEYL recognises that getting a good start in life, building emotional resilience, and getting maximum benefit from education are the most important markers for good health and well-being throughout life. Early Years settings can lay the foundations for lifelong health and well-being as they help children prepare for school.

There are 4 levels of the HEYL award: First Steps, Bronze, Silver and Gold. Each step with clear standards and criteria. Since the launch of HEYL in October 2018, 32 London boroughs have become involved in HEYL, and over 1,568 settings have registered to take part. The aim is to increase the number of early years settings taking part in the award locally which will positively have an impact on the health and well-being of children under 5 years by:

  • reinforcing healthy habits such as healthy eating, oral health, and daily physical activity
  • improving social and emotional well-being by increasing the early years and childcare uptake of the HEYL Project.

Early years settings are best placed and vital in laying the foundations for a long life, health and well-being, and enabling children to become ready for school.

As stated in the 2019 HEYL evaluation report, a considerable number of children’s services are spending time in childcare services with 13,262 registered early years providers offering 295,146 places. This shows that implementing the HEYL award programme has the potential to have an impact on the health of children across London. In Wandsworth, 53 early years settings have registered with the scheme and 37 have taken the first steps toward registration.

7. School Readiness

Children are assessed towards the end of reception year, data from which informs the education of individual children, and the planning of services which brings benefits to larger groups in the community.

7.1 Children Achieving a Good Level of Development

School readiness indicators in Wandsworth are consistently above both London and England percentages.

School readiness: percentage of children achieving a good level of development at the end of Reception: In 2022/23, Wandsworth’s rate was 71.9% (n=1877), which was the 6th highest in London, 6.9% higher than the England average and 4.0% higher than the London average. The latest Borough figure for 2022/23 was also 0.1% higher than in 2021/22, in comparison with 3.1% increase in England’s rate in the equivalent time period.

Source: OHID: Public Health Profiles

Source: OHID: Public Health Profiles

There is local recognition in Wandsworth that scores are beginning to plateau. Speech and language therapy (SALT) is embedded as part of the Children’s Centre’s offer, utilising group therapy and onward pathway to tier 3 specialist provision. The Children’s Team have a school readiness programme focusing on language enrichment and the identification of speech and communication difficulties. Health visitors have completed specialist speech and language training as part of a London wide initiative. The borough is working towards implementing the new Early Years Foundation Stage reforms which became statutory in September 2021 and has more of a focus on SALT for Early Years providers. Two key aims of these reforms are:

  • to place greater focus on language and communication
  • to support disadvantaged children and vulnerable groups.

Plans are to provide briefings for early years and childcare settings, headteachers and teachers, and continue to have training and professional development.

Throughout the pandemic Health Visiting Services have been key to ensuring all children reach a good level of development. Health visitors use the Ages and Stages Questionnaires and one year checks to assess if children’s social-emotional development is on schedule and identify those most likely to fall behind. Health Visiting Services were reduced during the pandemic following NHS National Directives. The service was temporarily re-fined to focus attention on those with higher needs, with the temporary suspension of some universal services. In response to the return to business as usual, the updated Healthy Child Programme combined with a significant national shortage of health visitors, commissioners and public health teams are re-structuring their services across London. This review programme, titled Reimagining Health Visiting, has been developed through consultation with staff, clients and commissioners, benchmarking with other 0-19 year services. This includes the review of commonalities across existing service specifications and demand, and capacity case modelling. It is also informed by the NHS Long Term Plan for England, CQC inspection feedback, review of caseload sizes, and different ways of working as a response to COVID-19.

As has been found nationally, the current clinical model for health visiting has been inflexible and the data set does not reflect the totality of what is delivered across the service. The new programme aims to rectify this. The Re-imagining Programme essentially seeks to move towards the use an ‘active’ and ‘community’ caseload model. The plan is to increase capacity for those identified as the most at need or at risk. Health visitors will be supported by an increase in the recruitment and deployment of staff nurses to support families assessed as requiring universal services. The initial antenatal and new birth visits will continue to be carried out by health visitors as will support for vulnerable families assessed as requiring a universal plus or plus services.

Healthy Early Years London in Wandsworth has been temporarily suspended due the ending of early years funding. Public health, in partnership with Wandsworth Early Years and Wandsworth Teaching Association, are developing a costed feasibility study to agree a way forward for the programme in Wandsworth.

Good Level of Development for Children on Free School Meals (FSM)

Despite Wandsworth’s high ranking for the overall school readiness for the reception year, the borough’s rank for the same indicator for children on FSM is much lower.

School Readiness: percentage of children with free school meal status achieving a good level of development at the end of Reception: In 2022/23, Wandsworth’s rate was 57.7% (n=301), which was the 13th highest in London, 11.9% higher than the England average and 0.2% lower than the London average. The latest Borough figure for 2022/23 was also 1.0% higher than in 2021/22, in comparison with 5.0% increase in England’s rate in the equivalent time period.

Source: OHID: Public Health Profiles

Source: OHID: Public Health Profiles

7.2 Communication and Language Development

Children who do not develop good oral language in early life are at greater risk of experiencing problems with literacy later, potentially impairing their ability to reach their academic potential. As the National Institute for Health and Care Excellence (NICE) explains: “Children and young people with communication difficulties are at increased risk of social, emotional and behavioural difficulties and mental health problems. So, identifying their speech and language needs early is crucial for their health and well-being. Many young children whose needs are identified early do catch up with their peers” 27.

Early identification and intervention ensure children start school in a position to flourish and minimises the development of gaps which can have a lasting detrimental impact. Research has shown that “children who had poor language skills at age five were about six times less likely to reach the expected standard in English and about 11 times less likely to reach the expected standard in maths at age 11” 28. In addition, only 15% of pupils with identified speech, language and communication needs achieve the expected standard reading, writing and maths at the end of primary school, compared with 61% of all pupils. As the government’s national plan to improve social mobility through education states: “Children who arrive at school in a strong position will find it easier to learn, while those already behind will face a growing challenge: early advantage accumulates, but so too does early disadvantage” 29.

Since 2011/12 there has been a steady increase in:

  • the percentage of children achieving the expected level in the Phonics Screening Check in Year 1, an increase of 20% to 85.5% by 2018/19
  • the percentage of children achieving at least the expected level in communication and language skills at the end of reception; more details below.

School readiness: percentage of children achieving at least the expected level of development in communication, language and literacy skills at the end of Reception: In 2022/23, Wandsworth’s rate was 74.0% (n=1932), which was the 5th highest in London, 7.5% higher than the England average and 5.1% higher than the London average. The latest Borough figure for 2022/23 was also 0.3% lower than in 2021/22, in comparison with 2.6% increase in England’s rate in the equivalent time period.

Source: OHID: Public Health Profiles

Source: OHID: Public Health Profiles

8. Hospital Admissions

8.1 Injuries and Accidents

Unintentional injuries form a major burden of disease in children and young people, and a major cause of inequality. In 2014/15, there were 19.6 million Accident and Emergency (A&E) attendances recorded at major A&E departments, single specialty A&E departments, walk-in centres and minor injury units in England. More than a quarter (25.9%) of attendances were made by children and young people (0–19 years). A&E admissions in Wandsworth have seen an encouraging downward trend in 0–19-year olds, statistically similar to the England average. However, trends in 0–4 years olds while significantly better than England, have seen an increasing trend in recent years. Attendances for this age group are often preventable, and commonly caused by accidental injury or minor illnesses which could be treated in primary care.

Under 5 Year Olds

Hospital admissions caused by unintentional and deliberate injuries in children (aged 0 to 4 years): In 2022/23, Wandsworth’s rate was 68.6 per 10,000 (n=125), which was the 11th lowest in London, 25.4% lower than the England average and 8.1% lower than the London average. The latest Borough figure for 2022/23 was also 35.9% lower than in 2010/11, in comparison with 35.9% decrease in England’s rate in the equivalent time period.

Source: OHID: Public Health Profiles

Source: OHID: Public Health Profiles

0–14 Year Olds

Hospital admissions caused by unintentional and deliberate injuries in children (aged 0 to 14 years): In 2022/23, Wandsworth’s rate was 58.7 per 10,000 (n=295), which was the 15th lowest in London, 22.0% lower than the England average and 2.3% lower than the London average. The latest Borough figure for 2022/23 was also 41.5% lower than in 2010/11, in comparison with 34.6% decrease in England’s rate in the equivalent time period.

Source: OHID: Public Health Profiles

Source: OHID: Public Health Profiles

15–24 Year Olds

Hospital admissions caused by unintentional and deliberate injuries in young people (aged 15 to 24 years): In 2022/23, Wandsworth’s rate was 64.8 per 10,000 (n=240), which was the 13th lowest in London, 31.2% lower than the England average and 4.9% lower than the London average. The latest Borough figure for 2022/23 was also 44.4% lower than in 2010/11, in comparison with 39.2% decrease in England’s rate in the equivalent time period.

Source: OHID: Public Health Profiles

Source: OHID: Public Health Profiles

8.2 Common Conditions

Lower Respiratory Admissions in Pre-school Children

Most of the lower respiratory tract infections in young children can be managed outside of hospital through better diet, hygiene and primary care support in advising and managing infections at home. High rates of hospitalisation might indicate the system for supporting predominantly young parents with managing their child’s lower respiratory infections has been inefficient.

Admissions for lower respiratory tract infections (2 to 4 years): In 2022/23, Wandsworth’s rate was 62.5 per 10,000 (n=65), which was the 8th highest in London, 45.8% higher than the England average and 35.8% higher than the London average. The latest Borough figure for 2022/23 was also 85.5% higher than in 2011/12, in comparison with 67.9% increase in England’s rate in the equivalent time period. Missing time series data for Wandsworth have been estimated using linear interpolation.

Source: OHID: Public Health Profiles

Source: OHID: Public Health Profiles

Asthma Admissions

Admissions for asthma (0 to 9 years): In 2022/23, Wandsworth’s rate was 144.3 per 100,000 (n=50), which was the 15th lowest in London, 6.7% lower than the England average and 10.9% lower than the London average. The latest Borough figure for 2022/23 was also 37.2% lower than in 2010/11, in comparison with 50.4% decrease in England’s rate in the equivalent time period.

Source: OHID: Public Health Profiles

Source: OHID: Public Health Profiles

Epilepsy Admissions

Admissions for epilepsy (0 to 9 years): In 2022/23, Wandsworth’s rate was 28.9 per 100,000 (n=10), which was the lowest in London, 69.0% lower than the England average and 63.9% lower than the London average. The latest Borough figure for 2022/23 was also 31.3% lower than in 2010/11, in comparison with 3.5% decrease in England’s rate in the equivalent time period.

Source: OHID: Public Health Profiles

Source: OHID: Public Health Profiles

Diabetes Admissions

In 2018/19 in Wandsworth there were virtually no admissions for diabetes in children under 10 years old. PHE has suppressed the borough’s numbers and the rates have not been calculated for Wandsworth. However, diabetes admissions data is available for all under 19 year olds, including young people aged 10-18 years.

Admissions for diabetes (under 19 years): In 2022/23, Wandsworth’s rate was 40.7 per 100,000 (n=25), which was the 14th lowest in London, 22.4% lower than the England average and 8.1% lower than the London average. The latest Borough figure for 2022/23 was also 23.0% higher than in 2010/11, in comparison with 18.2% decrease in England’s rate in the equivalent time period.

Source: OHID: Public Health Profiles

Source: OHID: Public Health Profiles

9. Healthy Weight in Children

The Government’s action plan to counteract the rise in childhood obesity 30 includes improving the nutritional content of food and drink, strengthening the information available to parents and the general public, and changing the way unhealthy food and sugary drinks are promoted. For example, removing offers for ‘buy one get one free’ on foods high in sugar. These actions are important to reduce the increasing financial burden the obesity epidemic is having on the NHS. Obesity-related health conditions are estimated to cost the NHS £6.1 billion per year 31.

9.1 Obesity and Overweight

Childhood obesity is defined as abnormal or excessive fat accumulation that presents a risk to health and is one of the most serious public health challenges of the 21st century 32. However, obesity is a complex issue and there is no singular solution. The UK is now ranked among the worst in Western Europe for childhood obesity rates and is one of the biggest health problems the country faces. Nationally, two thirds of adults, a third of 11–15 year olds, and a quarter of 2–10 year olds are overweight or obese.

Obesity and overweight disproportionately affects those from more deprived areas. This is seen most strongly in children with obesity prevalence, in the most deprived decile twice as high as those in the least deprived decile. Prevalence of obesity is also higher amongst children from particular ethnic minorities – boys in Year 6 from all Black Asian and Minority Ethnic groups are more likely to be obese than White British boys, and girls in Year 6 are more likely to be obese if they are from Black or Black African ethnic groups. Children with learning disabilities are also more likely to be overweight or obese.

In childhood, obesity is associated with several health risks, such as the development of eating disorders, musculoskeletal problems, respiratory problems and type 2 diabetes, which until recently was considered a health issue that only effected adults. Excess weight also has a significant impact on psychological well-being, with many children developing negative self-image and low self-esteem issues.

Obesity is most likely to be a result of diet and eating patterns and research indicates that 40% to 60% of obese school-age children become obese adults 33 and dietary behaviours established in childhood have been found to continue into adolescence and adulthood 34.

Obesity

Obesity in Reception

More than 1 in 5 children in England are obese or overweight by the time they start primary school, and this rises to one third by the time they are aged 11 years 35. In England, the National Child Measurement Programme (NCMP) measures the weight and height of children in primary schools in Reception (aged 4-5 years) and Year 6 (aged 10-11 years). The figures are based on large numbers of measurements and provide a robust assessment of obesity in children. However, the NCMP does not include children educated in the independent sector so the overall figures are incomplete.

Reception prevalence of obesity (including severe obesity): In 2022/23, Wandsworth’s rate was 7.9% (n=170), which was the 8th lowest in London, 14.2% lower than the England average and 15.7% lower than the London average. The latest Borough figure for 2022/23 was also 20.6% lower than in 2007/08, in comparison with 5.0% decrease in England’s rate in the equivalent time period. Missing time series data for Wandsworth have been estimated using linear interpolation.

Source: OHID: Public Health Profiles

Source: OHID: Public Health Profiles

Obesity in Year 6

By the time a child reaches Year 6 the percentage of obese children has increased three-fold.

Year 6 prevalence of overweight (including obesity): In 2022/23, Wandsworth’s rate was 34.8% (n=765), which was the 7th lowest in London, 4.9% lower than the England average and 10.4% lower than the London average. The latest Borough figure for 2022/23 was also 5.7% lower than in 2007/08, in comparison with 12.2% increase in England’s rate in the equivalent time period. Missing time series data for Wandsworth have been estimated using linear interpolation.

Source: OHID: Public Health Profiles

Source: OHID: Public Health Profiles

Obesity prevalence by ethnic group

Childhood obesity prevalence changes with age and ethnic group. In Wandsworth and nationally, the prevalence of obesity is the highest in Black ethnic groups and the lowest in White ethnic groups; the prevalence in Asian ethnic groups was somewhere in the middle. Interestingly, the pace of increase in obesity prevalence between reception and Year 6 varies even more substantially. For Black ethnic groups, the prevalence in Year 6 is 181% higher than in reception, in comparison with a 261% increase in white ethnic group and 316% increase in Asian ethnic groups, as per charts below.

Source: OHID: Public Health Profiles

Source: OHID: Public Health Profiles

Source: OHID: Public Health Profiles

Overweight

Overweight in Reception

Reception prevalence of overweight (including obesity): In 2022/23, Wandsworth’s rate was 19.2% (n=415), which was the 15th lowest in London, 10.0% lower than the England average and 4.3% lower than the London average. The latest Borough figure for 2022/23 was also 10.5% lower than in 2007/08, in comparison with 5.7% decrease in England’s rate in the equivalent time period. Missing time series data for Wandsworth have been estimated using linear interpolation.

Source: OHID: Public Health Profiles

Source: OHID: Public Health Profiles

Overweight in Year 6

Year 6 prevalence of overweight (including obesity): In 2022/23, Wandsworth’s rate was 34.8% (n=765), which was the 7th lowest in London, 4.9% lower than the England average and 10.4% lower than the London average. The latest Borough figure for 2022/23 was also 5.7% lower than in 2007/08, in comparison with 12.2% increase in England’s rate in the equivalent time period. Missing time series data for Wandsworth have been estimated using linear interpolation.

Source: OHID: Public Health Profiles

Source: OHID: Public Health Profiles

9.2 Healthy Weight in Children

Healthy Weight in Reception

Reception prevalence of healthy weight: In 2022/23, Wandsworth’s rate was 79.7% (n=1725), which was the 10th highest in London, 2.8% higher than the England average and 2.0% higher than the London average. The latest Borough figure for 2022/23 was also 3.2% higher than in 2007/08, in comparison with 1.8% increase in England’s rate in the equivalent time period. Missing time series data for Wandsworth have been estimated using linear interpolation.

Source: OHID: Public Health Profiles

Source: OHID: Public Health Profiles

Healthy Weight in Year 6

Year 6 prevalence of healthy weight: In 2022/23, Wandsworth’s rate was 63.6% (n=1400), which was the 7th highest in London, 2.9% higher than the England average and 7.6% higher than the London average. The latest Borough figure for 2022/23 was also 4.7% higher than in 2007/08, in comparison with 6.3% decrease in England’s rate in the equivalent time period. Missing time series data for Wandsworth have been estimated using linear interpolation.

Source: OHID: Public Health Profiles

Source: OHID: Public Health Profiles

9.3 Underweight Children

A child is classed as underweight when their body mass index (BMI) is less than the 2nd centile of the UK90 growth reference 36.

Underweight in Reception

Reception prevalence of underweight: In 2022/23, Wandsworth’s rate was 1.2% (n=25), which was the 9th lowest in London, 0.1% lower than the England average and 36.5% lower than the London average. The latest Borough figure for 2022/23 was also 15.9% lower than in 2007/08, in comparison with 7.6% decrease in England’s rate in the equivalent time period. Missing time series data for Wandsworth have been estimated using linear interpolation.

Source: OHID: Public Health Profiles

Source: OHID: Public Health Profiles

Underweight in Year 6

Year 6 prevalence of underweight: In 2022/23, Wandsworth’s rate was 1.6% (n=35), which was the 10th lowest in London, 1.8% higher than the England average and 21.7% lower than the London average. The latest Borough figure for 2022/23 was also 31.6% lower than in 2007/08, in comparison with 10.9% increase in England’s rate in the equivalent time period. Missing time series data for Wandsworth have been estimated using linear interpolation.

Source: OHID: Public Health Profiles

Source: OHID: Public Health Profiles

Eating disorders

The data in table below has been obtained from the North East London Commissioning Support Unit. It shows the number of child eating (ED) disorder contacts at CAMHS for the months of April to July 2021/22.

Source: NEL Commissioning Support Unit

We do not have available data to fully explore the impact of eating disorders on Wandsworth’s children and young people. The following data is taken from the most recent national study carried out by NHS Digital.

The 2017 Mental Health in Children and Young People Survey identified that 0.4% of 5-19 year olds surveyed had an eating disorder. Eating disorders were more common in girls (0.7%) than boys (0.1%), and in older age groups (0.1% of 5-10 year olds; 0.6% of 11-16 year olds; 0.8% of 17-19 year olds). Rates of eating disorder were higher in girls aged 17 -19 years (1.6%) than in other demographic groups. While the pattern of association between presence of eating disorder and age group looks different between girls and boys, this was not statistically significant.

The survey confirms an expected profile for eating disorders. While it can affect boys, it is primarily a disorder experienced by girls. The findings confirm the established pattern that vulnerability to eating disorder increases with age. The survey found a prevalence of one in sixty girls aged 17-19 years in every two classes. Girls aged 11-16 years eating disorders were evident in one in a hundred. These figures should be considered as possible underestimates.

The Wandsworth Public Health Department is conducting a comprehensive Mental Health Needs Assessment (MHNA) 2021/2022. This needs assessment will incorporate an in-depth review of the latest data available to identify the estimated prevalence of mental disorder in Wandsworth and will include eating disorders. The MHNA will use the NHS Digital national study Mental Health in Children and Young People 2017 (MHCYP, 2017) to estimate the number of girls and boys that we would expect to have an eating disorder. The MHNA will also examine service demand and utilisation for a more complete picture of need.

9.4 Prevention of Childhood Obesity

The causes of obesity and being overweight are multi-factorial, no one single factor can be attributed. The obesity systems map outlines the main areas that contain variables which are considered to affect the outcome of obesity directly or indirectly including environmental, societal and individual themes 37. These include variables such as an individual’s psychology and physiology, and the food and activity environment.

A growing body of evidence suggests a whole systems approach could help tackle obesity. The recent Public Health England document ‘Whole Systems Approach to obesity: A Guide to Support Local Approaches to Promoting a Healthy Weight’ is a professional resource designed to support local action. The guide describes a process, which can enable local authorities and their partners, to create a local whole systems approach to reducing obesity and promoting a healthy weight. It is understood there is no one singular solution; causes of obesity exist in the places where we live, work and play. The guide does not specify which policies, interventions or actions local areas should include in a whole systems approach. The approach needs to be agreed collectively by local stakeholders to reflect the local context 38. In 2019 the London Child Obesity Taskforce launched ‘Every Child a Healthy Weight’ campaign, which outlines ten ambitions on areas that are understood to reduce the risk of lifelong ill health for children. These ambitions have been chosen to reflect the circumstances in which children may live that makes it difficult for them to eat healthy food, drink water and be physically active.

Healthy Eating

At its simplest, excess weight in children is caused by an energy (calorie) imbalance and consuming too much energy compared with an expenditure. Children in the UK have diets that are too high in energy-dense foods, saturated fat and free sugars (sugars that are added to our food), all of which contribute to this imbalance. Children also consume too little fibre, fruit and vegetables 39 which counteract the overconsumption of calorie-dense foods by filling us up more than processed, sugary foods.

The adoption of a healthy diet from as young an age as possible is recommended 40. In general, a healthy diet is rich in fruit and vegetables, wholegrains, legumes and nuts, and low in foods high in saturated fat, salt and sugar. It is recommended that at least 400 grams (equivalent to approximately five portions of 80 grams) of fruit and vegetables per day (excluding starchy root vegetables) are consumed from two years of age 41.

The Public Health England Eatwell Guide 42 and the Department of Health ‘5 A Day’ Campaign aim to improve diet and nutrition in the general population and have been promoted widely. Nevertheless, only 18% of 5-15 year olds eat the recommended ‘5 A Day’ 43.

Research has indicated that over the last 20 years there has been a dramatic reduction intake in key nutrients in children, such as vitamin A, folate, calcium, zinc, iron and iodine 44, all of which are available in a healthy, nutrient-rich diet 45.

The implications of this are children from a young age do not have the required nutrients to support growth and development including the formation of healthy teeth, bones, body tissues and normal nerve function 46.

Breastfeeding

Risk factors begin from birth, starting with an increased risk of obesity for children who are not breastfed 47:

  • the number of children being breastfed in Wandsworth continues to increase
  • Wandsworth has seen an overall improvement in 6–8 weeks breastfeeding prevalence rates between 2018 to 2019, from 26% in Q1 to 79% in Q4
  • the overall total for the year is 56% which is higher than the England average of 42.7% 48.

Physical Activity

To stay healthy or to improve health, young people aged 5–18 years need to do three types of physical activity each week; aerobic exercise, exercises to strengthen bones, and exercises to strengthen muscles 49. Data on physical activity in children and young people in Wandsworth is scarce. The latest available borough’s data comes from Active Lives Children and Young People Survey, Sport England for year 2020/21.

Percentage of physically active children and young people: In 2022/23, Wandsworth’s rate was 58.8%, which was the highest in London, 25.1% higher than the England average and 28.7% higher than the London average. The latest Borough figure for 2022/23 was also 34.8% higher than in 2017/18, in comparison with 8.7% increase in England’s rate in the equivalent time period. Missing time series data for Wandsworth have been estimated using linear interpolation.

Source: OHID: Public Health Profiles

Source: OHID: Public Health Profiles

School nurses are in all schools across the borough and offer services to home educated children. School nurses conduct the NCMP and measure all children in Reception and Year 6. Children who are identified as overweight or obese are provided with appropriate support and advice and referred to the Health4Life Child Weight Management Service. This is run by CLCH and provides a family-based approach covering nutrition and physical activity.

The Family Weight Management Service is also available for children aged 2–5 years (pre-school) with weight more than 2 centiles above average height centile (using the UK-WHO 0–4 years growth charts in the red book), and women who have given birth in the previous two years who are obese (BMI ≥30). This is also run by CLCH as part of the 0–19 year old service. Wandsworth is also part of the Healthy Early Years London (HEYL) award scheme.

10. Oral and Dental Health

10.1 Decayed, Missing or Filled Teeth in 5 Year Olds

dmft (decayed, missing or filled teeth) in five year olds: In 2018/19, Wandsworth’s rate was 0.4 mean dmft per child, which was the 2nd lowest in London, 49.9% lower than the England average and 56.8% lower than the London average. The latest Borough figure for 2018/19 was also 52.3% lower than in 2014/15, in comparison with 5.2% decrease in England’s rate in the equivalent time period.

Source: OHID: Public Health Profiles

Source: OHID: Public Health Profiles

10.2 Visually Obvious Dental Decay in 5 Year Olds

Percentage of 5 year olds with experience of visually obvious dental decay: In 2021/22, Wandsworth’s rate was 21.3%, which was the 10th lowest in London, 10.1% lower than the England average and 17.6% lower than the London average. The latest Borough figure for 2021/22 was also 29.0% lower than in 2007/08, in comparison with 23.4% decrease in England’s rate in the equivalent time period.

Source: OHID: Public Health Profiles

Source: OHID: Public Health Profiles

11. Children and Young Peoples’ Mental Health

Mental health outcomes in young people aged 10–24 years are driven by economic disadvantage, and inequalities relating to other social determinants, such as ethnicity. The evidence from data on the causes of young people’s mental health across London include:

  • an increase in the number of young people over the age of 16 going into care
  • a significant rise in secondary school exclusions in England
  • high rates of loneliness and
  • despite falling unemployment rates young people are increasingly engaged in precarious employment such as zero-hour contracts.

Further detail on the mental health needs of children and young people can be found in Wandsworth Local Transformation Plan (LTP) for Children and Young People’s Mental Health and Emotional Well-being.

The percentage of school pupils with social, emotional and mental health needs in Wandsworth at 3.81% is significantly higher than both London and England levels (2.61% and 2.81% respectively) 50. This reflects wider social factors where pupils attend school and live in the borough.

The single largest reason that young people are referred into Wandsworth’s NHS Child and Adolescent Mental Health Service (CAMHS) Single Point of Access (SPA) is concerning behaviour. The reasons for behavioural problems can be because of parenting, environmental factors, and problems at school, such as bullying. However, behaviour problems can be because of a traumatic experience and because of social and communication difficulties, including autism spectrum disorder (ASD) and attention deficit hyperactivity disorder (ADHD). For these reasons, there has been joint working between the Council and CCG to commission a range of targeted and specialist support services for these young people most of which are accessible pre-diagnosis. These services include teams of drama therapists working in schools, provision from Contact, a voluntary sector organisation, psychologists and systemic therapists that work within the new Wandsworth Autism Advisory Service, Pupil Referral Units and schools. Wandsworth is the only borough in South West London to have a dedicated and specialist CAMHS Service for children with learning disabilities. Wandsworth has also invested in new treatments including Dialectical Behavioural Therapy (DBT) and Positive Behavioural Support (PBS) to help child and young people with more severe levels of challenging behaviour.

The second and third largest reasons for referrals into the CAMHS single point of access are anxiety, low mood and depression. Our partnership has invested in a large scaling up of support services, including our new Mental Health in Schools Trailblazers and Mental Health Clusters. We have divided all schools within the borough into four areas: Battersea, Balham & Tooting, Putney & Roehampton and Southfields & Wandsworth Town. Each of these areas has a team of specialists who are providing evidence-based treatments for anxiety, low mood and depression. Each team of specialists include a clinical psychologist, four education well-being practitioners trained in delivering new treatment models, drama psychotherapists, and occupational therapists supporting those children who have experienced trauma or have special sensory needs.

A smaller number of referrals are also received by the single point of access because of self-harm, obsessive compulsive disorders, emotional dysregulation, concerning sexualised behaviours, eating disorders and bereavement.

11.1 Children with Significant Social, Emotional and Mental Health Needs

School aged children with Significant Social, Emotional and Mental Health Needs is an indicator from PHE Public Health Profiles. The data represents the number of school children with special education needs (SEN) who are identified as having social, emotional and mental health as the primary type of need, expressed as a percentage of all school pupils. The Mental Health in Children and Young People Survey 2017 identified an estimated 4,800 children and young people in Wandsworth aged 5-17 years with a mental disorder. This includes emotional, behavioural and hyperactivity disorders, those on the autism spectrum, and those with eating and other less common disorders.

Primary School Children

School pupils with social, emotional and mental health needs: % of school pupils with social, emotional and mental health needs: In 2022/23, Wandsworth’s rate was 3.6% (n=671), which was the 2nd highest in London, 28.6% higher than the England average and 50.0% higher than the London average. The latest Borough figure for 2022/23 was also 26.5% higher than in 2015/16, in comparison with 34.4% increase in England’s rate in the equivalent time period.

Source: OHID: Public Health Profiles

Source: OHID: Public Health Profiles

Secondary School Children

School pupils with social, emotional and mental health needs: % of school pupils with social, emotional and mental health needs: In 2022/23, Wandsworth’s rate was 4.4% (n=582), which was the 4th highest in London, 25.7% higher than the England average and 37.5% higher than the London average. The latest Borough figure for 2022/23 was also 17.7% lower than in 2015/16, in comparison with 48.5% increase in England’s rate in the equivalent time period.

Source: OHID: Public Health Profiles

Source: OHID: Public Health Profiles

11.2 Self Harm

An additional mental health concern in Wandsworth is the rate of hospital admissions for self-harm for children and young people aged 10 – 24 years.

Hospitalisations as a Result of Self-harm in Children and Young People

Hospital admissions as a result of self-harm: In 2022/23, Wandsworth’s rate was 96.2 per 100,000 (n=15), which was the 12th lowest in London, 61.7% lower than the England average and 22.6% lower than the London average. The latest Borough figure for 2022/23 was also nan% higher than in 2011/12, in comparison with 102.8% increase in England’s rate in the equivalent time period. Missing time series data for Wandsworth have been estimated using linear interpolation.

Source: OHID: Public Health Profiles

Source: OHID: Public Health Profiles

Hospital admissions as a result of self-harm: In 2022/23, Wandsworth’s rate was 254.3 per 100,000 (n=35), which was the 16th lowest in London, 45.7% lower than the England average and 0.9% lower than the London average. The latest Borough figure for 2022/23 was also 25.1% higher than in 2011/12, in comparison with 0.8% decrease in England’s rate in the equivalent time period.

Source: OHID: Public Health Profiles

Source: OHID: Public Health Profiles

11.3 Types of Services

To address the level of deprivation and emotional and mental health needs Wandsworth Council and South West London CCG/NHS have significantly increased investment in services for children and young people, including a significant scaling up of treatment services in schools. Since 2015, the budget for these services has increased from £3.4m to £7.5m in 2021. These include treatments across a spectrum of need (mild, moderate and severe) and in response to a range of emotional and mental health conditions. New provision includes prevention, early intervention and specialist treatments.

Tier 1: Prevention

In 2019, Wandsworth secured additional funding in order to pilot Mental Health in Schools Trailblazers, which have since been scaled up further to include provision covering all four cluster areas of the Borough: Battersea, Balham & Tooting, Putney & Roehampton and Wandsworth Town & Southfields. Wandsworth has a mental health trailblazer for the further education colleges in the borough, including South Thames College. These mental health in schools clusters focus on treatment and prevention with the development of the ‘whole school approach’ to improving emotional, mental health and well-being of children and young people. Schools are supported to work together to improve all aspects of school life and systems of support.

Schools have developed a range of training and projects to improve the understanding of emotional well-being and support to students, staff, parents and carers. For example, schools in Battersea have developed a sensory programme to support children who have experienced trauma, and where there are emerging challenging behaviours. These projects are improving emotional well-being. Other key whole school approaches include Place2Be, PATHS (Promoting Alternative Thinking Skills) programmes, SEAL and Jigsaw, which are helping pupils in primary schools develop improved emotional literacy and resilience. These programmes have helped reduce school exclusions and improved emotional well-being.

The local strategy to reduce levels of anxiety, low mood and depression includes improving environments and systems important to young people’s lives. Mental Health in Schools Trailblazers includes a whole school approach with programmes similar to Place2Be and PATHS ensures all school staff are trained in understanding emotional and mental health needs, identifying problems early and providing effective support. Effective teaching of emotional literacy in schools means that children are able to understand and deal with their own feelings and emotions, have better friendships, and are able to deal with conflicts and difficulties.

Tier 2 and 3: Universal, Targeted and Specialist Services

The two most common causes of death among young people are accidents and self-harm, both potentially preventable. When benchmarked against other London boroughs, Wandsworth performs statistically better or similar for A&E attendances across all 0–19 years age groups, except for those aged 10-14 years where attendances are statistically worse. However, attendances for self-harm may be experiencing an increase in trends.

Children and Adolescents Mental Health (CAMHS) Ttransition to Adult Services

Nationally, 90% of young people that transition from CAMHS to adult mental health services report a low level of satisfaction. In Wandsworth satisfaction with transition to adult mental health services is 40%. Wandsworth has a dedicated transition worker, who supports multi-agency colleagues to plan for the transition of a young person to adult mental health services, particularly for complex cases.

12. Young People’s Sexual Health

12.1 Teenage Pregnancy

Teenage parents and their children experience poorer health, educational and economic outcomes, and inequality 51. High rates of teenage pregnancy are most often associated with low educational attainment, disengagement from school, economic deprivation and poor mental health. Young people at increased risk of teenage pregnancy and early parenthood include children of teenage mothers, and those who are looked after, partaking in substance misuse, involved in crime, at risk of or experiencing child sexual exploitation, or who may go missing from home or care. Other significant risk factors include the onset of sexual activity, poor contraceptive use, and repeat abortions.

Nationally, recent trends have seen improvements in some areas of adolescent health including young people’s health risk-taking behaviour 52. Young people’s rates of teenage pregnancy rates have been on the decline over the past decade.

Under-16 Conceptions

Under 16s conception rate / 1,000: In 2021, Wandsworth’s rate was 1.8 per 1,000 (n=8), which was the 10th highest in London, 12.6% lower than the England average and 24.5% higher than the London average. The latest Borough figure for 2021 was also 75.3% lower than in 2009, in comparison with 71.0% decrease in England’s rate in the equivalent time period.

Source: OHID: Public Health Profiles

Source: OHID: Public Health Profiles

Under-18 Conceptions

Under 18s conception rate / 1,000: In 2021, Wandsworth’s rate was 7.7 per 1,000 (n=31), which was the 12th lowest in London, 41.2% lower than the England average and 18.9% lower than the London average. The latest Borough figure for 2021 was also 89.2% lower than in 1998, in comparison with 72.0% decrease in England’s rate in the equivalent time period.

Source: OHID: Public Health Profiles

Source: OHID: Public Health Profiles

Termination of Pregnancies in Under 18 Year Olds

Under 18s conceptions leading to abortion (%): In 2021, Wandsworth’s rate was 58.1% (n=18), which was the 10th lowest in London, 8.7% higher than the England average and 6.5% lower than the London average. The latest Borough figure for 2021 was also 3.9% lower than in 1998, in comparison with 25.9% increase in England’s rate in the equivalent time period.

Source: OHID: Public Health Profiles

Source: OHID: Public Health Profiles

12.2 Sexually Transmitted Infections

Chlamydia Detection

Public Health England recommends local authorities work towards achieving a chlamydia detection rate of above 2,300 per 100,000 population aged 15 to 24 years; the recommended level was set at a high level to encourage an increase in volume of screening and diagnoses. The PHE expectation is that increased level of screening is likely to result in a continued chlamydia prevalence reduction.

Chlamydia detection rate per 100,000 aged 15 to 24: In 2023, Wandsworth’s rate was 2613.0 per 100,000 (n=968), which was the 5th highest in London, 69.0% higher than the England average and 50.3% higher than the London average. The latest Borough figure for 2023 was also 13.5% lower than in 2012, in comparison with 26.2% decrease in England’s rate in the equivalent time period.

Source: OHID: Public Health Profiles

Source: OHID: Public Health Profiles

Chlamydia Screening

Chlamydia proportion of females aged 15 to 24 screened: In 2023, Wandsworth’s rate was 39.5% (n=7947), which was the 2nd highest in London, 93.6% higher than the England average and 62.6% higher than the London average. The latest Borough figure for 2023 was also 6.4% lower than in 2021, in comparison with 4.7% decrease in England’s rate in the equivalent time period.

Source: OHID: Public Health Profiles

Source: OHID: Public Health Profiles

Other Sexually Transmitted Infections, STIs

There are no published non-chlamydia STI indicators for young people aged 15–24 years old. The only non-chlamydia STI indicator is for the 15–64 years age group. Based on the national data, the impact of STIs remains greatest in young people aged 15-24 years old, with most of STIs diagnosed in people aged under 35 years old 53. The rates of STIs are the highest in under 25 year olds, hence it is fitting to report on this indicator in this section.

New STI diagnoses (excluding chlamydia aged under 25) per 100,000: In 2023, Wandsworth’s rate was 1745.7 per 100,000 (n=5744), which was the 10th highest in London, 235.8% higher than the England average and 42.1% higher than the London average. The latest Borough figure for 2023 was also 15.5% higher than in 2012, in comparison with 8.5% decrease in England’s rate in the equivalent time period.

Source: OHID: Public Health Profiles

Source: OHID: Public Health Profiles

13. Looked After Children

When family relationships breakdown or circumstances are concerning, it may be necessary for children to become looked after by the local authority to ensure they are safeguarded and protected. A decision to take a child into care is not made lightly. Key factors such as risk of harm, child’s health and well-being are all considered holistically before a decision to provide the statutory care. This is because evidence shows that longer term outcomes (including education, health and employability) for children, who do not remain at home are usually poor. This makes looked after children one of the most vulnerable groups in society.

Key Points:

  • The complexity of situations and needs of children who come into care can be unpredictable.
  • Over half (52%) of children with a new episode of care in the year were in need because of abuse or neglect.
  • During 2021 Wandsworth will implement a new Family Safeguarding Practice Model with the aim of keeping children safe at home.
  • Socio-economic disadvantage continues to be a strong factor associated with entering care.
  • Although there has been a decrease in the number of unaccompanied asylum-seeking children, Wandsworth still has higher than the national percentage by more than 50% (national 6%, Wandsworth 13%). The level of current and ongoing need into adulthood will also require further exploration, especially for long-term monitoring of the looked after children’s outcomes.
  • Some specific cohorts of children have been identified as having significant representation in the looked after children cohort including special educational needs and children with education, health and care plans. Increasingly services across social care are having to work in partnership to ensure that the complex needs of the children are met, and positive outcomes achieved. The largest ethnic group of children looked after is Black or Black British, with the proportion of Black or Black British looked after children continuing to increase over the last five years.
  • Finally, it is evident that the borough continues to increase the completion rates for review health assessment (RHA), raising above the rates of statistical neighbours and London. However, the challenge remains of being able to make statements about the overall health of looked after children, particularly their physical health, as the Council is not currently capturing this information. This is something the local authority and the CCG will need to address jointly.
  • An area of continued good practice for the looked after children is around the completion of RHA. All areas of health care and development assessments have increased on previous years are better than statistical neighbour and London. There should be complacency and work will continue to embed good practice for all looked after children.

The journey of a child into becoming looked after by the local authority starts with a referral to children’s social care services. Following the referral, an initial assessment by the service can identify the child as needing social care support. The numbers of children identified as ‘in need’ has been steadily rising in Wandsworth. Becoming a looked after child is not determined by one specific predictive risk factor as there are a variety of complex needs and situations that result in children entering care. National research shows that entering care is strongly associated with poverty and deprivation, including low income, parental unemployment and relationship breakdown.

Please note that, unless otherwise stated, data included in this Joint Strategic Needs Assessment is taken from the 2019 Children’s Social Care Benchmarking Tool.

Some of the frequent reasons for entering care as well as typical characteristics of looked after children are outlined below:

Frequent Reasons for Entering Care

13.1 General Level of Need and Prevalence

Children in Need and Children Looked After

Children in need In 2021, Wandsworth’s rate was 278.8 Rate per 10,000 children aged <18 (n=1812), which is the 8th lowest rate in London, 13.2% lower than the England average and 17.7% lower than the London average. The latest Borough figure was also 11.6% higher than in 2013, in comparison with 2.9% decrease in England’s rate in the equivalent time period.

Source: ONS: Children in need statistics, 2021

Source: ONS: Children in need statistics, 2021

Looked after children can be aged between 0–16 years old. A child stops being looked after when they are adopted, return home, or turn 18 years old. However, local authorities are required to support children leaving care at 18 years old until they are at least 21 years old. The definition of looked after children and duties of the local authority towards them are set out in the Children Act 1989. Local authorities have duties to young people leaving care or care governed by the Children (Leaving Care) Act 2000. Children considered looked after can be broken down into three main groups:

  • looked after child
  • unaccompanied asylum-seeking children
  • care leavers.

A brief outline of the general level of need in Wandsworth for each of these three groups is given in the table below. Level of need will then be explored by specific health needs and services’ response to needs.

Five-year Trend for Number of Looked After Children (LAC) and Unaccompanied Asylum Seeker Children (UASC) on 31 March 2020

*-care leavers who are eligible for leaving care services and have left care. Source: SSDA903 Annual Report 2019 – 2020

Children and young people come into the care of the local authority when it is necessary. Decisions are based on clear, effective, comprehensive and risk-based assessments that include input from professionals working with the family. At the end of March 2020, 277 children and young people were looked after by the local authority, this equates to a rate of 43 per 10,000 of the population, the 14th lowest in London. This is lower than statistical neighbours and the London average. 13% of the looked after children population are unaccompanied asylum-seeking children and the majority of looked after children are aged 10+ years (73%) which is linked to a particularly high level of need in this age group. The latest rate of looked after children in Wandsworth was 7.5% higher from year 2011, in comparison with a 13.6% increase in England’s rate in the equivalent time period.

Children in care: In 2022/23, Wandsworth’s rate was 40.0 per 10,000 (n=237), which was the 7th lowest in London, 43.7% lower than the England average and 21.6% lower than the London average. The latest Borough figure for 2022/23 was also 21.6% lower than in 2018/19, in comparison with 7.6% increase in England’s rate in the equivalent time period.

Source: OHID: Public Health Profiles

Source: OHID: Public Health Profiles

Characteristics

Wandsworth has a high proportion of looked after children from Black Asian and Minority Ethnic backgrounds at 40%, when compared with the statistical neighbour average of 29.8%, London average of 29.0%, and the national average of just 8%. National data for the reporting year ending 31 March 2020, indicates that a larger proportion of males than females were looked after (56% compared with a 44%). This is reflected in the local Wandsworth picture for 2020 – 60% male and 40% female.

Putting the age, gender and ethnicity data together, it is evident that in 2020 Wandsworth had an increased proportion of looked after children accommodated voluntarily under Section 20 who are male, aged 16 years and over, and from Black ethnic groups 54.

  • In Wandsworth, in March 2020, the largest ethnic group of looked after children were from Black or Black British ethnic groups. The proportion has increased from 35% to 40% over the last five years.
  • When compared with the population of school pupils from Black ethnic groups (21%) this was a significant over-representation, more pronounced than in London and England.

Corporate Parenting

All local authorities have a duty to safeguard and promote the welfare of children under their care known as corporate parenting. It refers to the collective responsibility of the Council, elected members, employees, and partner agencies, to provide the best possible care and safeguarding for the looked after children. As the corporate parent Wandsworth Children’s Services aim to deliver the care and support, they require and improve outcomes for a group who are statistically more likely to have poorer life chances. Wandsworth has a lower rate of looked after children than national, London and statistical neighbour averages but this does not mean there is not a considerable level of need in the population.

As a corporate parent, Wandsworth is committed to supporting children in care and care leavers to achieve good outcomes and to reach their potential. Attention has been given to identifying areas of unmet need within the looked after children and care leavers population. Three main areas of interest have been identified:

  • unknown health needs of the unaccompanied asylum seeking children population
  • issues of engagement when young people are looked after or transitioning into adulthood
  • with the transition out of our services into the independent world often being a point of significant increase in mental health difficulties.

Staying put arrangements can often mitigate significant adverse health issues in our care leavers population. The provision of continuity and stability into adulthood is not always possible or practical, leading to an impact on a young person’s well-being due to feeling inadequately prepared for independence.

  • In 2018/19 in there were 15 children in Wandsworth in foster care who turned 18 years old, and 100% of them continued living in foster care placements.
  • The national statistic for 2018/19 was 3,770 children turned 18 years old in foster care with 49.6% (1,880) staying put.

13.2 Children Entering (or in) Care in Wandsworth

Children and young people going missing from home are at greater risk of entering care. It can represent problems or difficulties at home, including abuse, neglect and family breakdown 55. The groups most frequently entering the care system are the children and young people affected by abuse and neglect. In the reporting year ending 31 March 2020, over half (52%) of children with a new episode of care were due to abuse or neglect, lower than the national statistic of 59% but higher than the London average of 43%.

The next most common cause in Wandsworth is absent parenting (18%), compared with a 13% nationally and the London average of 24%. Wandsworth has seen a decrease of children with a new episode of care linked to absent parenting from 24% in 2018/19. In part, this is due to the lower numbers of unaccompanied asylum seeking children accommodated. Wandsworth reports a lower proportion of looked after children (5%) than the national average (13%) within the category of family dysfunction. There was an increase in parental disability or illness from 6% to 10% from 2018/19 to 2019/20.

Comparing the Breakdown of Category of Need for New Episodes of Care in Wandsworth, London, and England, 2018–2020

Source: SSDA903 LAC Return 2019–2020

Child Protection Plans

The number of families with a Child in Need plan and the number of families with Child Protection Plans (CPP) can both be drivers for children coming into the care of the Council in the near future. Again, abuse or neglect accounted for the largest proportion by far when considering primary need, at 54%. This is followed by family in acute stress at 14%, parental illness or disability at 8%, and family dysfunction at 7%. The rate of children who were the subject of a CPP on 31 March 2020 per 10,000 children nationally was 36. Emotional abuse (50%) and neglect (34%) were by far the most significant. As the corporate parent, Wandsworth is committed to supporting looked after children and care leavers, so they achieve good outcomes and reach their potential.

The aim of Corporate Parents for Wandsworth’s looked after children and care leavers is to make sure the rights of children and young people in care are respected by:

  • assessing their needs
  • promoting their best interests
  • considering their well-being
  • providing opportunities for them
  • making sure their voices are heard
  • providing advice and assistance when needed
  • making sure services are accessible.

Research evidence indicates that looked after children have poorer life opportunities when compared with their peers who have not been in care. Therefore, looked after children and young people should be a priority as one of the most vulnerable and disadvantaged groups in our society. Aspirations should be high and not compromised.

Unaccompanied Asylum-seeking Children

A group of particular concern is unaccompanied asylum-seeking children (UASC). They are children and young people, who are seeking asylum in the UK but have been separated from their parents or carers. While their claim is processed, they are cared for by the local authority. Nationally, 6% of looked after children on 31 March 2019 were unaccompanied asylum-seeking children, with Wandsworth reporting 13%. The national figure has been consistent since 2016. However, the distribution across local authorities varies with Wandsworth seeing a significant increase in 2019 and a decrease in 2020.

Age assessments for this group are sometimes required and are the responsibility of the local authority. It is important for safeguarding reasons, to identify and support those below 18 years of age, to ensure they are accommodated and cared for as children, and to ensure that those over the age of 18 years old receive appropriate care as adults.

When unaccompanied asylum-seeking children seek support, they receive input from specialist social workers. They ensure appropriate paperwork to secure their legal status is completed and that immediate basic needs, such as clothing, health and travel, are addressed quickly. There is a dedicated team in the Looked After Children and Care Leaving Service with expertise on meeting needs of unaccompanied asylum-seeking children. This is supported by the use of interpreters for full consideration and understanding of their diverse needs. The local authority is committed to addressing the specific vulnerabilities of unaccompanied asylum-seeking children.

Although unaccompanied asylum-seeking children share many of the characteristics as other looked after children, in many respects, they are quite different. The complexity of health needs stemmed often means the assessments take longer and require more resources. They have their dental health checked, as part of their Initial Health Assessment (IHA) but may not necessarily see a dentist. Moreover, information collected on their health needs is combined with general looked after children’s data, leading to a lack of clarity on the distinct health needs of these children. More clarity on the general and dental health of unaccompanied asylum seeking children is required.

Special Educational Needs and Disabilities (SEND)

According to the Department for Education, looked after children are almost four times more likely to have special educational needs and disabilities, and are over nine times more likely to have an education, health and care plan (EHCP). The incidence of special educational needs and disabilities among looked after children and children in need in Wandsworth, in comparison with the national average for 2017–2019 is shown in the figure below.

Incidence of SEN among looked after children and children in need in Wandsworth and England (2017 – 2019)

Source: Outcomes for looked after children by Local Authorities in England, 31 March 2019.

At the end of March 2020, of the 277 looked after children, five had a primary need of disability, 1% of the cohort. 196 children were of statutory school age, Reception to Year 11, and therefore open to the Virtual School:

  • of the 196, 90 children had an identified SEND need
  • 49 of the 90 children with SEND, had an EHCP.
  • a further 34 children were identified as having or needing SEND support but did not have an EHCP plan. In 2018, nationally 55.5% of looked after children had a SEND, compared with a 45.7% of CIN and 14.6% of all children 56.

13.3 General Health of Children Looked After

Health Overview: Assessments and Checks

The latest statistics published by the Department for Education highlights that Wandsworth has higher performance for health assessments (98%) and dental checks (96%) for looked after children, than the averages for England (90% and 86%) and London (92% and 84%). Nationally there is no information reported on the weight of looked after children, which means the extent of obesity is unknown.

The general health of looked after children is captured through an Annual Health Report from providers. The Annual Health Report (2019/20) highlights health indicators that are measured and demonstrate above average attainment in all areas of health. The qualitative data in this report highlights that looked after children feel supported by their health team, with professionals acknowledging them, actively listening, ensuring their voice is heard, and supporting their health and well-being. Local authorities are responsible for making sure a health assessment is carried out for every looked after child. There are two different timescales for providers when completing health assessments:

• Initial Health Assessment (IHA) are statutory and must be completed within 28 days of a child coming into care • Review Health Assessment (RHA) are required every six months for children under 5 years and annually thereafter.

IHA completed for children coming into care in the last six months averaged at 58%. Periodic reviews indicate initial health assessments take place, but the reports are not completed in a timely fashion. This is primarily due to delays in health providers sending through and uploading reports. Wandsworth CCG has developed an action plan to address this matter.

RHA compliance (excluding breach exceptions) has been variable throughout 2019. The highest compliance of above 90% was recorded in May, July, August, November and December, the lowest recorded compliance was 63% in January. This is reflective of the instability of the nursing team and nursing shortages, and the removal of breach exceptions. The clinical nurse specialist post was filled permanently in September 2019, but the named nurse post was vacant from mid-February until the end of March 2020. There was bank nurse cover for approximately two days per week and during this interim period the compliance was relatively stable. For the whole of 2019/20 the overall compliance was at 83% 57.

Based on 2019/20 data on health care and development assessments of children who had been looked after continuously for at least 12 months:

  • 98% had their review health assessment compared with 94% statistical neighbours, and 90% nationally, an increase for Wandsworth from 89% in the previous year
  • 81% immunisations were up to date compared with 89% in statistical neighbours, and 87% nationally. This represents the joint lowest proportion (after remaining stable from 2017/18) over the last 7 years
  • 97% of looked after children had their teeth checked by a dentist compared with 89% in statistical neighbours, and 85% nationally, an increase in Wandsworth from 88% the previous year
  • 100% of these children under 5 years had up to date development assessments compared with 97% for statistical neighbours, and 88% nationally. Wandsworth has consistently achieved 100% in this area for the past 7 years
  • approximately 79% of children have an up-to-date health check and the majority have completed a Strengths and Difficulties Questionnaire (SDQ)
  • 99% demonstrated improvements in the timeliness of review and completion in comparison to previous months
  • the strengths and difficulties questionnaire informs children’s health plans around their emotional and mental well-being, scores which are then reviewed for referral to the CAMHS services.

On leaving care, young people are provided with a health passport providing a comprehensive summary of their medical history, recommendations for future health care, and sign posting to health and supporting services. In 2019/20 the designated nurse worked with the named nurse and young people to produce a Moving On booklet.

The template is being used as an exemplar of best practice nationally with other CCGs and providers:

  • this has been completed and issued to 144 young people over the year
  • it was well received and evaluated by the young people.

This was 98% of the care leavers cohort turning 16 years or 18 years and is a significant improvement from 2018/19.

Emotional Well-Being and Mental Health

Looked after children and young people have a 50% increase of having a diagnosable mental health disorder when compared with their peers. This is due to their pre and post care experiences including attachment difficulties, trauma, and the effects of abuse on the developing brain. Delays in identifying and meeting their emotional well-being and mental health needs can have far reaching effects on all aspects of lives, including their chances of reaching their potential and leading happy and healthy lives as adults 58. There is a dedicated LAC Child and Adolescent Mental Health Service (CAMHS) provision in Wandsworth. However, looked after children and young people accessing CAMHS, and ongoing therapeutic support, is not currently captured in existing reporting, meaning a lack of clarity in the level of need. Work on data collection has commenced to ensure accurate data is captured 59.

Completion of the strengths and difficulties questionnaire (SDQ) is a national performance indicator. Introduced by the Department for Education (DfE) it measures emotional health amongst the looked after children. The tool captures the perspectives of children and young people, their parents and teachers. There were 143 looked after children at the end of March 2020 aged 5-16 years who had been in care for at least 12 months. 140 had an SDQ in the year.

Figure below presents the SDQ completion rates for Wandsworth, London and England.

Looked After Children Aged 5–16 in Care for at least 12 months with a Strengths and Difficulties Questionnaire Score, Percentage, 2015 – 2019, Wandsworth

The average SDQ score per child for Wandsworth in 2020 was 13, a normal score in line with the London average of 13 and slightly below the England average of 14. The proportion of children with an SDQ score that is a cause for concern was 24% (33 children). No comparative data for 2020 is currently available. However, in 2019 the borough’s proportion of concerning SDQ scores was similar, 22.5 per 100, 2nd lowest in London, 41.5% lower than the England average, and 29.1% lower than the London average. The 2019 figure was 39.1% lower from 2014/15, in comparison with a 4.2% increase in England’s rate in the equivalent time period.

Percentage of looked after children whose emotional wellbeing is a cause for concern: In 2022/23, Wandsworth’s rate was 28.0% (n=33), which was the 9th lowest in London, 30.0% lower than the England average and 20.0% lower than the London average. The latest Borough figure for 2022/23 was also 24.3% lower than in 2014/15, in comparison with 8.1% increase in England’s rate in the equivalent time period.

Source: OHID: Public Health Profiles

Source: OHID: Public Health Profiles

Table below summarises the borough’s SDQ scores of looked after children. Of those who have an SDQ score of 15+, 95% received some form of intervention, ranging from therapies, counselling, skills work support and monitoring, if they refuse intervention, or are deemed to be doing well.

SDQ Score Bandings for Wandsworth’s Children in Care, 2016–2020

Unaccompanied asylum-seeking children are at particular risk of developing emotional well-being and mental health issues. The journey to and settlement in the UK, and the possibility of not being able to return home and to their families, is very stressful. Emotional well-being is likely to be particularly challenging and the likelihood of having specific mental health needs is high. Access to CAMHS and other specialist mental health services is important for these children and young people. It is crucial for professionals to fully understand the plight and circumstances of unaccompanied asylum seeking children 60.

The placement stability of children is of critical importance for their long-term, emotional and social well-being. There has been a decrease in the number of three or more placement moves across the year bringing us more in line with London average, at 11%. The primary reason for placement changes is due to behavioural issues of the child. A review is underway to understand how we can better support children and young people, as well as carers, in managing behavioural issues. A Foster Carer survey aimed at understanding the challenges during the lockdown will help us design and implement the right packages of support.

Multiple placement moves have an impact on the consistency of care for children. While some of these moves are positive, to secure permanency for example, a high proportion have been placement breakdowns driven by behavioural issues. Placement moves are considered with caution and collectively at the care panel and the monthly monitoring meetings for children at risk. This ensures moves are only undertaken when absolutely necessary.

Wandsworth’s latest proportion of children who had three or more placements in the 12 months preceding 31 March 2020 was 12 per 100, the 4th highest in London, 9.1% higher than the England average, and 20.0% higher than the London average. The latest borough figure was 50.0% higher from year 2016, in comparison with no changes in England’s rate in the equivalent time period.

Children looked after 3 or more placements during the year In 2021, Wandsworth’s rate was 9.0 % (rounded) (n=23), which is the 15th lowest rate in London, 0.0% higher than the England average and 0.0% higher than the London average. The latest Borough figure for 2021 was also 10.0% lower than in 2018, in comparison with 18.2% decrease in England’s rate in the equivalent time period.

Source: ONS: Children looked after in England including adoptions, 2021

Source: ONS: Children looked after in England including adoptions, 2021

Looked after children remain local whenever possible to ensure they continue to receive the support and resources they need. The proportion of children placed more than 20 miles from home in Wandsworth is below the national, local and statistical neighbour averages. However, the proportion is rising in comparison to the previous years.

The percentage of children having a missing incident from their placement (19%) was above that of statistical neighbours (13.3%), London (14%), and England (11%). This could be a further indicator of the impact of being a looked after child on emotional health.

Substance Misuse

Looked after children can be particularly vulnerable to developing substance misuse problems. Between the ages of 11–18 years they are asked about substance misuse, given support and advice, and offered referrals to appropriate services. According to the LAC health team, 9% of young people aged 11–18 years reported substance abuse. 92% of these were offered intervention but only 45% accepted. Local authority end of year data indicated only 2% of young people in care for over one year had a substance misuse problem 61.

Wandsworth’s CAMHS team has seen a rise in children referred to the substance misuse services. There has been a concerted effort to ensure children receive a Drug User Screening Tool Assessment DUST (81%) and referred on to appropriate services. The CAMHS team has seen an overall rise in referrals for emotional health and well-being in direct correlation to the effects of the pandemic reported nationally. CAMHS have reviewed all referred children and established most are in receipt or have had an offer of appropriate support to help them with their emotional well-being.

At the end of March 2020 there were 187 children who had been in care for at least 12 months. Of these, 35 children were identified as having a substance misuse problem equating to 19% of the cohort. This was higher than the 2019 London average of 6%, and the England average of 4%. 31 (89%) accepted and received intervention in the year, above the 2019 London average of 43%, and England average of 46%.

Looked After Children Identified as Having a Substance Misuse Problem During the Year, 2015 – 2019

13.4 Outcomes for Looked After Children/Care Leavers

Looked after children and care leavers are supported to achieve their full potential. The Virtual School headteacher has responsibility for the education, employment and training outcomes for looked after children aged 3–25 years. Each child has a dedicated advisory teacher who ensures every learner has a robust, targeted and intervention led Personal Education Plan (PEP) completed each term. The PEP has been crucial during the pandemic to maintain, assess and reassess the educational needs of children. Our Virtual School has ensured over 90% of looked after children have a termly PEP, which more recently have been completed virtually using Microsoft teams. Every PEP is signed off by the Virtual School headteacher who quality assures and provides feedback. Sample auditing takes place on a termly basis with one-to-one feedback to advisory teachers, with the plan moving forward to make this multi-agency. The quality of the majority of plans is assessed to be good or better.

Attainment for looked after children at Key Stage 4 is well above the most recent available national average, with 35% of eligible children achieving level 5 or above in English and Maths in 2020. For statutory school age pupils, attendance prior to lockdown was 91% since the start of the academic year and this level of attendance has been maintained. The number of looked after children who received one or more fixed-term exclusions has remained constant over the last two years at 11%, marginally below the national number, with no permanent exclusions. The Virtual School leads on a range of out of school hours opportunities to enable learners to benefit from both aspirational and subject focused activities. We intend to capitalise on the successes of the Virtual School through increased investment. The plan is to expand its remit to support children identified in need of support and protection known to children’s services.

The Virtual School has identified opportunities through Spring Forward (part of the Royal Springboard Foundation) to develop academic mentoring and summer camps for disadvantaged learners. We will implement a Year 12/13 Virtual School partnership where learners can benefit from subject specific academic tutoring. Social care has secured a new mentoring opportunity for care leavers through the charity Grand Mentors. A worker from the charity will be based in Future First and will work alongside young people to match them to the charity mentees. The aim is for young people to access a range of mentoring opportunities to help them navigate their journey into adulthood.

Care Leavers

Local authorities have duties to young people leaving their care. Care leavers numbers have increased from 243 in January 2019, to the current number of 293, of which 274 (93%) are in touch with the service. This growth in numbers has been consistent over the last five years partly due to an increase in older teenagers coming into care in the previous three years.

Most care leavers are able to live independent lives with 61% living in independent or semi-independent accommodation. Children’s services are working closely with the borough’s Housing Department and Registered Social Landlords (RSLs) to ensure care leavers can access suitable housing.

Plans are in place to enable care leavers to continue to obtain the healthcare as well as arrangements to ensure a smooth transition from child to adult health services. On leaving care, young people are provided with a health passport summary. In Wandsworth a Moving On booklet has recently been produced which has been well received 62.

Generally, there is a good level of engagement with care leavers in Wandsworth. At the end of March 2020, the local authority were in touch with 98% of care leavers aged 17–18 years, who were looked after for a total of at least 13 weeks after their 18th birthday. This is higher than the statistical neighbour and national averages of 96% and 93% respectively. For 19–21 year olds the contact rate drops to 92%, however this is still above statistical neighbour (90%) and national (89%) averages.

Number of Wandsworth Care Leavers Aged 17–21, 2015–2020

Source: SSDA 903 data return

13.5 Other Areas of Need for Looked After Children

There are a number of areas where the Council has identified potential unmet need within the looked after children and care leavers population.

  • One of the most significant areas of unmet need is within the unaccompanied asylum-seeking children population. Health needs of unaccompanied asylum-seeking children are often unknown due to the circumstances in which they reside in the UK, making it very difficult to give them the right support and service to meet their health needs.
  • There are issues with engaging with young people when they are looked after, or when they are transitioning and have a larger degree of independence. This group of young people are often unwilling to engage with the local authority/services, which makes it difficult to understand their needs and support them. Furthermore, it hinders the ability to conduct health and dental assessments.

During periods of transition out of children’s services into adult services or out of social services altogether, there can be issues with mental health. Staying Put arrangements allow young people who have been living in foster care to remain in the former foster home after the age of 18 years. However, this is not always possible or practical. However, if the foster carer cannot extend their care, it can impact on the young person’s well-being if they do not feel sufficiently prepared for adulthood and independence.

In 2017/18 there were no young people in foster care who became 18 years old and remained living with their foster carer under a Staying Put arrangement. This is significantly lower than our statistical neighbours who have an average of 10.7 young people becoming 18 years old in foster care, and 7.9 young people who became 18 years old in foster care and remained living with their foster carer. This demonstrates a significant decrease from previous years, whereby 14 young people used the staying put service in 2016/17, and 9 young people in 2015/16. However, in 2018/19 there were 15 children in Wandsworth in foster care who turned 18 years old and 100% of them continued living in foster care placements. The national statistic for 2018/19 was 3,770 children turning 18 years old in foster care, with 49.6% (1,880) continuing to live with their foster families.

13.6 Evidence Based Interventions and Good Practice

Evidence indicates high performing local authorities are those with strong leaders, who have an aspirational vision of effective corporate parenting for all looked after children and young people. These authorities embed partnership and multi-agency working at the heart of the planning process and ensure that children and young people are fully engaged in the design and delivery of services 63.

Children in Care Kouncil (CLICK)

Wandsworth children are at the heart of everything the Council does. Their voices and lived experiences are central to the work of Children’s Services. There are three participation groups for looked after children and care leavers known as the Children in Care Kouncil (CLICK). Each group meets on a regular basis and are consulted on services they receive, noting where improvements can be made. The Children Services Directorate hear from CLICK representatives on a regular basis, through training sessions for social workers, to attending and contributing to the Corporate Parenting Panel.

Family Group Conferencing (FGC)

One evidence-based intervention highlighted in the 2015 policy paper on looked after children was Family Group Conferencing (FGC). FGC is a decision making and planning process, which focuses on the welfare of the child or young person. FGCs are used as a mechanism which enables formal systems to work in partnership with the family and community systems. FGC puts families in charge of decision making and holds them responsible for all actions. An FGC can be used in various contexts. In relation to looked after children, it can help to prevent children being put into care by assisting families to take responsibility and be proactive in relation to the welfare of their children. FGC has been used in the UK since 1992 and there is considerable evidence which demonstrates it is an effective way of bringing families together for making positive decisions about the welfare of their child/children. The plans, produced in FGC and assessed by social workers, have averted children going into care in 32% of cases and prevented court proceedings in 47% of cases. Therefore, early intervention through schemes similar to family group conferencing can strengthen family relationships empowering parents and their children to take control over key decisions 64.

Social Work Practices

NICE guidance recommends publishing and regularly updating a directory of resources for looked after children and young people to aid social workers, and as a resource guide for looked after children, young people and care leavers 65.

Communication and Engagement with Young People

To meet the diverse needs of all looked after children and young people, it is necessary to have an adequate range of suitable placements, including secure and custodial care. It is important to ensure children are involved in decisions about placement changes. Children and young people report that they value honesty from those responsible for their care about where they can and cannot influence decisions 66.

Trusted Adults

The relationships between a child or young person, their carer and professionals, and in particular, the continuity of relationships, is central to achieving positive outcomes for looked after children. There is a huge degree of importance attributed to a looked after child forming secure attachments and establishing a sense of permanence. According to NICE guidance, the child’s need to be loved and nurtured is fundamental to achieving long-term physical, mental and emotional well-being. In the guideline, it recommends the commissioning of services that enhance the quality of life of the child or young person by promoting and supporting their relationships with others 67.

The Action for Children - Two of a Kind Service matches care experienced by independent visitors with young people in the care system. It aims to enhance the life chances of children in care by facilitating access to education, reducing isolation, and providing long-term stability/relationships. The service also trains and supports people who have been through the care system to become independent visitors, hence improving their confidence and skills. The service aims to break down negative stereotypes about people in care. Independent visitors are trained through a structured schedule. Their own experience of care enables them to provide empathetic and tailored support. The service has successfully appealed to harder to reach young people (those involved in criminal activity or not in education, employment or training) 68.

Interventions Supporting Transitions into Adulthood

The transition to adulthood for young people in care can be difficult. Evidence indicates that services designed with young people in mind and delivered by friendly, approachable professionals can help young people find the right support and advice at the right time, to help them become independent69.

Evidence indicates that effective care planning, led by social workers assists permanence and reduces the need for emergency placements and placement changes. Good care planning supports the quality of the relationship between the child or young person and carer by minimising disruption, increasing attachment, providing greater placement stability, and ensuring stable education.

Evidence indicates that developing a positive personal identity and a sense of personal history is associated with high self-esteem and emotional well-being. Life story work, as an ongoing activity, can help children and young people understand their family history and life outside of care. Children and young people also have needs and preferences for contact with valued people and participation in the wider community as ways to build their self-esteem and assertiveness.

Mental Health Interventions

Evidence suggests early intervention to promote mental health and well-being can prevent the escalation of challenging behaviours and reduce the risk of placement breakdown. Flexible, sensitive and accessible mental health services and skilled interventions are essential for looked after children and their carers. These services should have the capacity and expertise to work with Black, Asian and Minority Ethnic children, and unaccompanied asylum-seeking children and young people. Strategic planners need to identify how appropriate services will be commissioned to ensure these looked after children and young people are not marginalised. Diversity champions are key to this process.

It is important to ensure that unaccompanied asylum-seeking children and young people have access to specialist psychological services (including CAMHS) with the necessary capacity, skills and expertise to address their particular and exceptional health and well-being needs, including:

  • post-traumatic stress
  • dislocation from country, family, culture, language and religion
  • risk of sexual exploitation
  • lack of parental support and advocacy in a foreign country
  • stress related to the immigration process
  • physical and emotional trauma
  • increased risk of suicide and mental illness.

13.7 Data Limitations

The main data and information limitations regarding data and information on looked after children in Wandsworth, is the lack of long-term health information about children leaving care or leaving the area. This can make it difficult to gain a full insight into the health needs of looked after children and care leavers.

There is also a lack of data on transitions out of services or into adults services. Once a care leaver enters adulthood, the Children’s Services stop providing care and do not have responsibility for them after the age of 25 years. The service has no visibility of where the former looked after children go or if they re-enter adult social services as they are given new identity codes.

There are inconsistencies across datasets between the local authority and the CCG. Data within this Joint Strategic Needs Assessment has been gathered largely from the local authority. However, some important information is held by the CCG. CCGs record the same sets of data as the local authorities but there are often discrepancies. Care needs to be taken here as to which data are appropriate, not to confuse the two, or use them interchangeably.

14. Special Educational Needs and Disabilities. Hospital Admissions

14.1 Introduction

A child or young person with learning difficulty or disability may require special educational provision. The definition of a child or young person with special educational needs or disabilities (SEND) is set out in the Children and Families Act 2014 70. Local authorities have statutory duties and responsibilities for this group of children and young people. These are outlined in the Children and Families Act 71, supporting guidance, and the SEND Code of Practice 72. These include information regarding how they are categorised and supported through education, health and care plans (EHCPs) and SEND support.

SEND can affect a child or young person’s ability to learn through:

  • behaviour or ability to socialise and make friends
  • reading and writing
  • ability to understand information and concepts
  • concentration levels
  • physical ability.

Wandsworth considers children and young people with SEND, and the quality of support they receive, to be a significant priority at a local authority level. Nationally, the number of pupils classified as having SEND has increased for a fourth consecutive year. Wandsworth has a higher-than-average number of pupils recorded as having SEND within the school population compared with statistical neighbours and nationally. It also has a higher-than-average proportion of EHCPs within the resident population.

There are a number of predictive factors for the development of young people who have SEND. Many may be a result of biological factors but there are a number of social factors which may make a child more likely to develop a special need or disability. Factors explored include birth and maternal indices, age, gender and ethnicity, socio-economic disadvantage, being a looked after child, and crime.

There are some limitations to the data quality and information within the Special Needs Assessment Service. Variation across datasets with regards to population and categorisation of need, and the complexity of needs, means children may be subject to multiple services who store information across different, often incompatible, systems. The concept of unmet need has been explored in certain cohorts within the SEND population where there are potential gaps, and it is important the local area considers ways in which these can be resolved.

Research has been undertaken to gain some insight into interventions and approaches that work according to the evidence base, whether this be through guidance or looking at what is being done in other local areas. This may help inform future service provision, improve support and services currently offered, and specifically target areas of unmet need.

14.2 Needs of Children and Young People with SEND

The level of need within the Wandsworth population is explored, highlighting significant increases in the number with EHCPs over the previous years, and higher than average proportions of EHCPs and SEND support within the school population. Cross border movement is one possible reason for this due to large numbers of out of borough residents accessing educational provision within Wandsworth, particularly specialist provision.

Various specific areas of need are explored in more detail and key findings indicate:

  • a significant and increasing prevalence of autism spectrum disorder (ASD) as a primary need
  • high prevalence of social, emotional and mental health needs in Wandsworth in comparison to the national picture, and a concerning incidence among Black Caribbean pupils, highlighting an ongoing issue with overrepresentation in certain ethnic groups
  • high level of speech, language and communication needs (SLCN) which need to be carefully considered among the English as an additional language (EAL) cohort
  • good educational outcomes for SEND Support, but not so good for EHCPs with issues regarding EHCP timeliness
  • Issues in the transition process from children’s to adults services, meaning planning is not always happening early enough to the detriment of the young person’s health.

Children and Families Act 2014

The Children and Families Act (2014) (Part 3) 73 states that a child or young person has SEND if he or she has a learning difficulty or disability which calls for special educational provision. As defined in this 2014 Act, a child of statutory school age or a young person has a learning difficulty or disability and significantly greater difficulty in learning than the majority of others of the same age or has a disability which prevents or hinders making use of facilities generally provided for others of the same age in mainstream schools or mainstream post-16 institutions. Children of statutory school age has a learning difficulty or disability if he or she is likely to fall within the above definition when of compulsory school age or would do so if special educational provision was not made for them. Compulsory school age ends on the last Friday of June in the academic year in which they become 16 years old. Until they are 18 years old, they must stay in full-time education, start an apprenticeship or traineeship, or spend 20+ hours a week working or volunteering while in part-time education or training 74.

Under Part 3 of the Children and Families Act 2014 a local authority in England has a duty to exercise its functions to identify all children and young people in the area who have or may have SEND. Local authorities and partner commissioning bodies are also required to put in place joint commissioning arrangements to plan and jointly commission education, health and care provision for children and young people with SEND.

Major reforms to the support system were implemented by the government as part of the Children and Families Act 2014. The changes were intended “to put children and parents at the heart of the system”. Some of the key aims were to ensure children’s needs would be identified earlier, families would have more say in decisions, and support services would be better integrated. The Act also replaced Statements of Special Educational Needs and Learning Difficulty Assessments with the Education, Health and Care Plan (EHCP). It covers support for pupils with special educational needs and disabilities (SEND) from birth to 25 years of age 75. Since 1st September 2014, all new statutory assessments have been made under this new system.

Under the Act, support for children with SEN is categorised under the following:

  • SEND Support – the majority of children and young people with SEND will have their needs met through the graduated approaches embedded in early years settings, schools and colleges
  • Education, Health and Care Plans (EHCPs) for children and young people up to the age of 25 years who require more support than is available at SEND Support. These plans identify the educational, health and social needs, identify the outcomes to be achieved and define the additional support needed to enable the child/young person to achieve the outcomes.

In order to make sure the key messages in this JSNA are clear, information largely correlates with the two abovementioned cohorts: those on SEND Support (data includes children and young people attending Wandsworth schools, whether they are resident in the Borough or not), and those with an EHCP (data refers to children and young people resident in Wandsworth, whether they attend school in or out of Borough i.e., resident population). However, we have occasionally used a third cohort of those within the school population with EHCPs to give a fuller picture of the school population with SEND in relation to their peers without SEND. In January 2020, 75% of the SEND (Reception to Year 11 pupils) were also in the school census.

As part of the reforms, in 2014, the Department for Education and the then Department of Health jointly published the SEND Code of Practice (2015), providing statutory guidance on duties, policies and procedures relating to Part 3 of the Children and Families Act 2014 and associated regulations. Local authorities must have regard to this guidance 76.

Local authorities have a crucial role to play as they have statutory responsibility for ensuring that children, young people and families receive the necessary support. The SEND Code of Practice highlights the need for local education, health and social care services to work together to provide the right support for pupils with SEND to ensure they can achieve the best possible outcomes.

Pupils with SEND

Currently children and young people with SEND are a national priority and challenge, with the number of pupils with SEND having increased for the fourth consecutive year, following a period of year-on-year decreases from 2010–2016. According to the Department for Education (DfE) 77, over 1.3 million pupils in England were recorded as having special educational needs and disabilities (SEND) in January 2020, representing 15.5% of all pupils. This increase has been driven by both the number of pupils with an EHCP and with SEND Support.

Pupils with special educational needs and disabilities are some of the most vulnerable in the school system. The quality of the support they receive can significantly impact their life experiences, well-being, educational attainment, likelihood of employment, and long-term life prospects. It is important that pupils with SEND are supported effectively so that they, as all children, achieve well in their early years, at school and in college, and lead happy and fulfilled lives.

The borough has a higher than average percentage of SEND pupils with 17.9% compared to 15.4% nationally, and 16.0% across statistical neighbours 78. A key factor that differentiates SEND provision in Wandsworth is the high number of children and young people attending special schools who are not Wandsworth residents.

  • Wandsworth is home to a large amount of specialist provision, including three regional special schools. This may explain why there are more pupils with SEND being educated in the borough. 32.1% of pupils attending state funded special schools live in another local authority. This is considerably above the national average of 8.9%, and the London average of 16.7% 79.

  • Wandsworth has the 2nd highest percentage of 0–24 year old residents with EHCPs amongst statistical neighbours, and 32nd highest among all local authorities putting it in the top third nationally 80. This shows that despite out of borough residents forming a significant part of the special school population, in terms of the Wandsworth resident population with EHCPs, Wandsworth is still above average.

  • The large proportion of non-residents places a significant demand on services in the borough and this needs to be considered as a local priority. Taking account of all state funded schools (primary, secondary and special), Wandsworth sits above the national average for the number of pupils with SEND support.

  • In January 2020, 13.2% of pupils attending state funded schools in Wandsworth were receiving SEND Support, compared with 12.1% nationally and 12.4% amongst statistical neighbours. There are variations across schools and between primary and secondary phases. The percentage of primary school pupils with SEND support is 13.1%, similar to the national rate of 12.8%. Support in secondary schools is 1.9% higher than the national rate (13.0% vs 11.1%).

  • Furthermore, 2.8% of Wandsworth residents aged 0–24 years had an EHCP compared with 2.3% nationally.

  • Wandsworth’s 2018 proportion of primary and secondary school children with special educational needs was 17.3%, significantly higher than England and London averages, and 4th highest in London.

  • The latest borough figure was 16.1% lower from year 2014, in comparison with a 19.4% decrease in England’s rate over the equivalent time period.

Pupils with special educational needs (SEN): % of school pupils with special educational needs: In 2022/23, Wandsworth’s rate was 19.7% (n=8543), which was the 4th highest in London, 13.9% higher than the England average and 18.7% higher than the London average. The latest Borough figure for 2022/23 was also 13.9% higher than in 2015/16, in comparison with 20.1% increase in England’s rate in the equivalent time period.

Source: OHID: Public Health Profiles

Source: OHID: Public Health Profiles

Cross Border Movement

A large number of out of borough residents are accessing services due to the high level of provision in Wandsworth. According to DfE data from January 2020 on local authority cross border movement of special school pupils resident in England, 30.7% of pupils attending state funded special schools in Wandsworth live in another local authority, significantly higher than the national average of 8.5%, and London average of 16.5%.

For mainstream schools the equivalent figures are:

  • 9% of those attending state funded primary schools in Wandsworth live in another local authority, compared with 3.8% nationally, and 8.7% in London
  • 28% of secondary school pupils attending state-funded secondary schools in Wandsworth live in another local authority, compared with a 9.3% nationally and 20.3% in London 81 82.

From this data we can see the local authority cross border movement in London is generally much higher than it is nationally. However, Wandsworth still sits above the London average. The data shows a significant proportion (almost a third) of pupils attending state funded special schools in Wandsworth are not residents in the borough. Geographical variation may reflect differences in local approaches and in the characteristics of local authorities 83. Wandsworth’s high proportion of specialist provision is attracting residents from other boroughs.

In 2020, there were 842 pupils attending Wandsworth’s special schools, representing 2% of the total pupil population in Wandsworth. This is higher than the 1% of the pupil population attending special schools across statistical neighbours 84. This difference can be accounted for due to the amount of specialist provision in Wandsworth, including three regional special schools, providing places for many children and young people resident outside the borough. There are other factors accounting for increased numbers of children in specialist provision. The local authority has been actively increasing its specialist provision to meet the demand for local places, and to meet parents’ expectations and preferences.

14.3 Predictive Risk Factors

In January 2020 over 1.3 million pupils in England were recorded as having SEND. Whilst there are a variety of reasons why a special educational need or disability may be prevalent in a child or young person, there are a number of predictive factors for SEND:

  • children can be born with a disability or special need due to several maternity and birth related factors
  • certain characteristics related to age, gender and ethnicity are predictive of those being identified with SEND but they are not the only causal features
  • interrelation of social factors must be considered, particularly regarding ethnicity where overrepresentation of certain ethnic groups in the SEND cohort may be related to the misidentification of need, cultural barriers and misunderstanding
  • wider social determinants of health including the variation in experience have been identified as the main factor influencing health outcomes, with studies finding social determinants have more of an influence on health than healthcare, behaviours and genetics
  • social determinants are the conditions in which people are born, grow, live, work and age and these determinants are a factor for health inequalities - the unfair and avoidable differences in health status 85.
  • there are also biological and social predictive factors in relation to the prevalence of SEND.

Maternity and Birth

Recent years have seen an increase in maternal age. This is associated with higher risk factors for conditions associated with learning disabilities, such as Down’s Syndrome. Fertility rates for women aged 40 years + increased by 1.3% nationally between 2016–17. In Wandsworth this is particularly high with 101 women per 1,000 aged 35–39 years giving birth, compared with a 67.5 per 1,000 nationally, and 31 per 1,000 women aged 40-44 years giving birth, compared with 14.9 per 1,000 nationally 86.

The number of women having multiple births (two or more babies from one pregnancy) can be a predictor for the development of SEND. The multiple birth rate in 2017 nationally was 15.9 per 1,000 women. This compares to 17.4 per 1,000 women in Wandsworth. Multiple birth pregnancies are associated with a higher risk of stillbirth, infant deaths and child disability 87.

Smoking during pregnancy increases the risk of complications such as miscarriage, premature birth, a low-birth-weight baby and still birth 88. According to 2016/17 published data 10.7% of women nationally smoke at time of delivery. Premature babies are more likely to have a SEND, a learning difficulty (such as dyslexia or autism), or a sensory difficulty such as deafness or impaired vision that requires special educational assistance. The severity of the problems depends on the degree of prematurity. This risk of SEND associated with prematurity declines steadily with gestational age up to 36 weeks. A baby born at 24 weeks of gestation is more likely to have a SEND later in life than a baby born at 36 weeks. In this particular study it was found that babies born at 24–27 weeks were 6.92 times as likely to have a SEND as those born at 40 weeks.

Immunisation rates can also be a predictor for the development of SEND. The World Health Organisation (WHO) set a target of 95% coverage for vaccine-preventable diseases, including the combined measles, mumps and rubella (MMR) vaccine, in order to target elimination or control. Measles, mumps and rubella and other infectious diseases can lead to serious long-term health implications, including the development of SEND. According to 2018/19 data, the national average for MMR completion (two doses) at age 5 falls below the WHO target at 86.4%. Wandsworth sits significantly below the WHO target and the national average at 79.4%, slightly higher than the London average (76.3%) .

Gender and Ethnicity

Nationally, according to school data, more boys than girls are identified as having SEND across all age groups. In January 2020, 24.9% of male pupils had SEND compared with 11.8% for females. There is evidence to suggest that ethnicity plays a part in children’s likelihood of being identified as having SEND, with 16.0% of Black pupils identified as having SEND in January 2020, compared with 16.4% of White British pupils, 15.2% of mixed ethnicity pupils and 11.9% of Asian pupils 89.

Analysis of ethnicity data from the Disabled Children’s Register (DCR) and pupil census show the link between ethnicity and SEND. According to this analysis, children and young people of Black, mixed or other ethnicities are more likely to be identified as having SEND. In Wandsworth, specifically, Asian or Asian British children are underrepresented on the DCR compared with a Wandsworth 0–18 Asian population (9% compared with an 11%, respectively). Black or Black British and mixed children and young people are overrepresented on the DCR (22% and 17%, respectively, compared with a 16% and 14% of the Wandsworth 0–18 years population).

An Oxford University study on ethnic disproportionality in the identification of SEND based on a 2016 school census found substantial ethnic disproportionality in certain areas, with the majority remaining apparent even after accounting for pupil background characteristics. Marked disproportionality was found for the following ethnic groups and SEND:

  • Black Caribbean and Pakistani pupils are overrepresented for moderate learning difficulty (MLD), Indian and Chinese pupils are underrepresented for MLD
  • Black Caribbean and Mixed White & Black Caribbean pupils are substantially overrepresented for social, emotional and mental health (SEMH) needs
  • All Asian groups are substantially underrepresented for SEMH and for autism spectrum disorder (ASD). Disproportionality was found not to vary much across Local Authorities; however, some variation does exist, and it is important for local authorities to identify where this is apparent and to explore factors that may be associated with it.

Socio-economic Disadvantage

There is a strong link between poverty and SEND. Children from low income families are more likely than their peers to be born with inherited SEND, more likely to develop SEND in childhood, and less likely to move out of SEND categories while at school. Households with poor social determinants, for example, poorer early years’ experience, low incomes and overcrowding and/or cold housing, are associated with a higher prevalence of SEND. The proportion of children under 16 years living in low-income families nationally is 17%, and Wandsworth is similar at 17.2% 90.

Department for Education (DfE) statistics show a clear link between SEND and children living in poverty. Eligibility for free school meals (FSM) is an indicator of deprivation. In January 27.1% children and young people who qualify for free school meals are much more likely to have special educational needs or disabilities than children and young people who are not eligible for FSM (12.5%).

The largest difference occurs with pupils with SEMH as their primary type of need, where 34% of pupils with SEND Support and 43% of pupils with an EHCP are eligible for FSM, compared with a 13% of pupils without SEND 91.

In Wandsworth, 33% of pupils with SEND are also eligible for FSM, compared with a 20% of the total Wandsworth pupil population. This disparity is notable within the primary school population, as 32% of primary school pupils with SEND are eligible for FSM compared with a 19% of the total primary school population 92.

Furthermore, from conducting an internal analysis on SEND provision (SEND, SEND Support, EHCP) and Income Deprivation Affecting Children Index (IDACI) in the Wandsworth school population we can see that pupils with a SEND are consistently more likely to be experiencing deprivation than those without a SEND. This is most prevalent within the EHCP population but can be seen across all three categories.

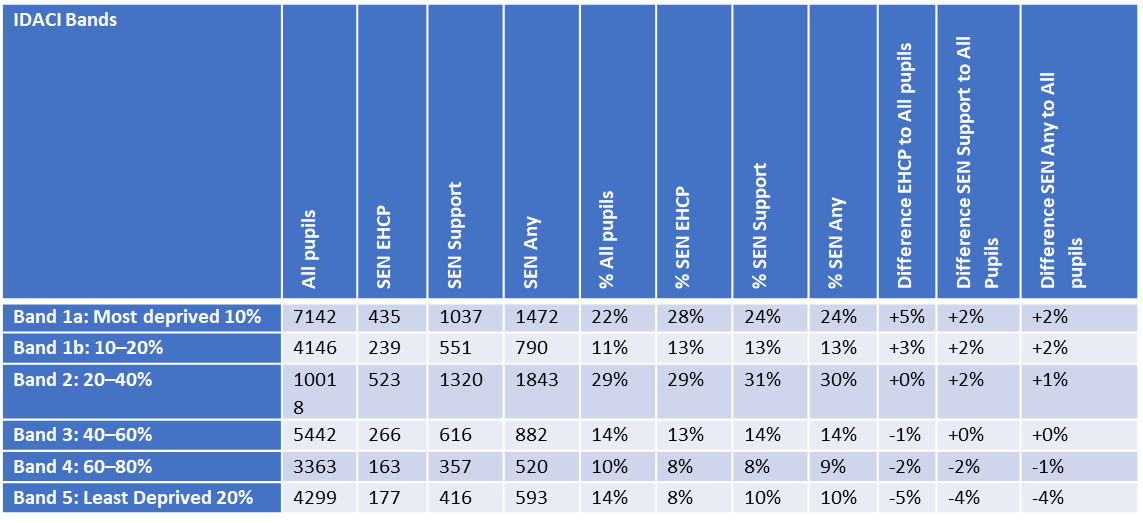
October School Census 2019 - SEND Provision and IDACI in Wandsworth School Population

The Millennium Cohort Study showed that physical difficulties and behavioural difficulties were particularly strongly associated with low socio-economic status. Children living in poverty are more likely to develop some forms of SEND, such as behavioural difficulties, as they experience persistently challenging family circumstances 93.

Looked After Children / Children in Need

Nationally, looked after children have higher levels of SEND 94 than their non-looked after peers. The DfE has estimated that around half of help or protection, including looked after children have SEND . The incidence of SEND among looked after children and children in need in Wandsworth in comparison to the national average for 2017–2019.

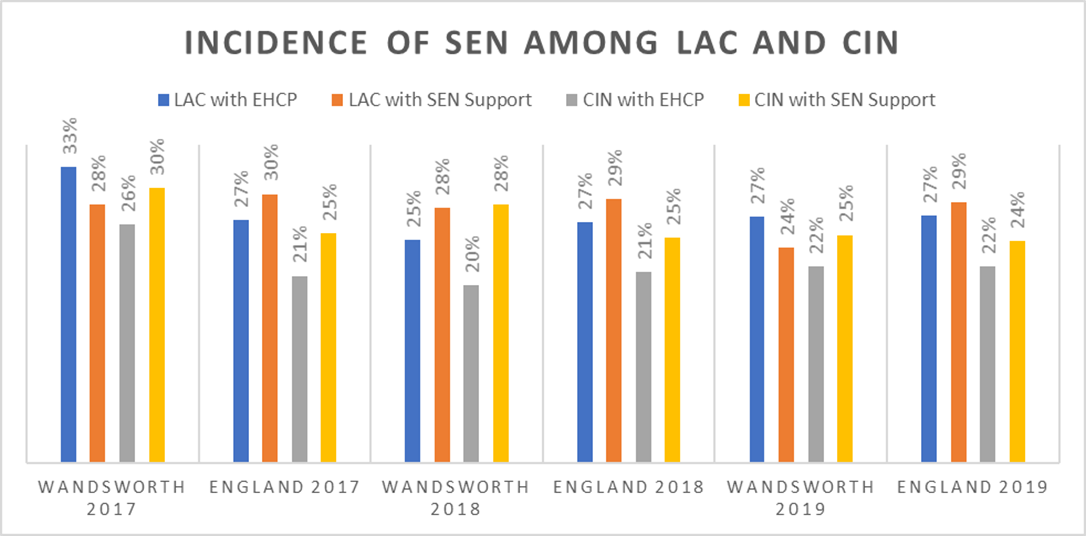
Incidence of SEND Among Looked After Children and Children in Need in Wandsworth and England, 2017–2019

In July 2019, Wandsworth had a total of 305 looked after children. Of this cohort, 42 children are recorded as having a disability (14%). In May 2019, 179 looked after children were within statutory school age (Reception to Year 11) and therefore open to the Virtual School. Of this cohort, 93 (53%) have SEND needs, including 17% with an EHCP.

Involvement in Crime

A 2016 report from the Ministry of Justice and Department for Education 95, those young offenders sentenced in 2014 (at the end of KS4 in academic year 2012/13) had a greater proportion with SEND, when compared with the overall state-funded pupil population. For all youth justice disposal types, behavioural, emotional and social difficulties (BESD) was by far the most prevalent primary SEND type in the matched cohort for those recorded with SEND. In 2019, 0.6% of the 0–25 years SEND resident population were known to the YOT service 96.

14.4 Education, Health and Care Plans (EHCP)

The total number of children and young people with an Education, Health and Care Plan (EHCP) resident in Wandsworth was 2,418 in January 2020. This represents a 91% increase since the SEND reforms were introduced in 2014 (1,265). According to the table below, Wandsworth shows the 2nd highest increase in EHCPs amongst statistical neighbours between 2016 and 2020. This represents a 91% increase since the SEND reforms were introduced in 2014 (1,265). According to the table below, Wandsworth shows the second highest increase in EHCPs amongst statistical neighbours between 2016 and 2020.

In January 2020, 2.8% of Wandsworth residents aged 0–24 years had an EHCP compared with 2.3% nationally, as per table below. Since 2016 Wandsworth has had a 73% increase in the number of residents with an EHCP, compared to 52% nationally. Wandsworth has the 2nd highest percentage of residents aged 0–24 years with EHCPs amongst statistical neighbours, and 32nd highest among all local authorities 97.

The increase in volume of EHCPs is largely in the under 5 years, 16–19 years, and 20–25 years age groups. The increase in the older age groups can be attributed to government policy to raise the age of EHCPs to 25 years. It included those in college who had previously had a Learning Difficulty Assessment (LDA) rather than a Statement of SEND. An increase in primary aged pupils with EHCPs is in excess of any increase that may be anticipated due to population changes.

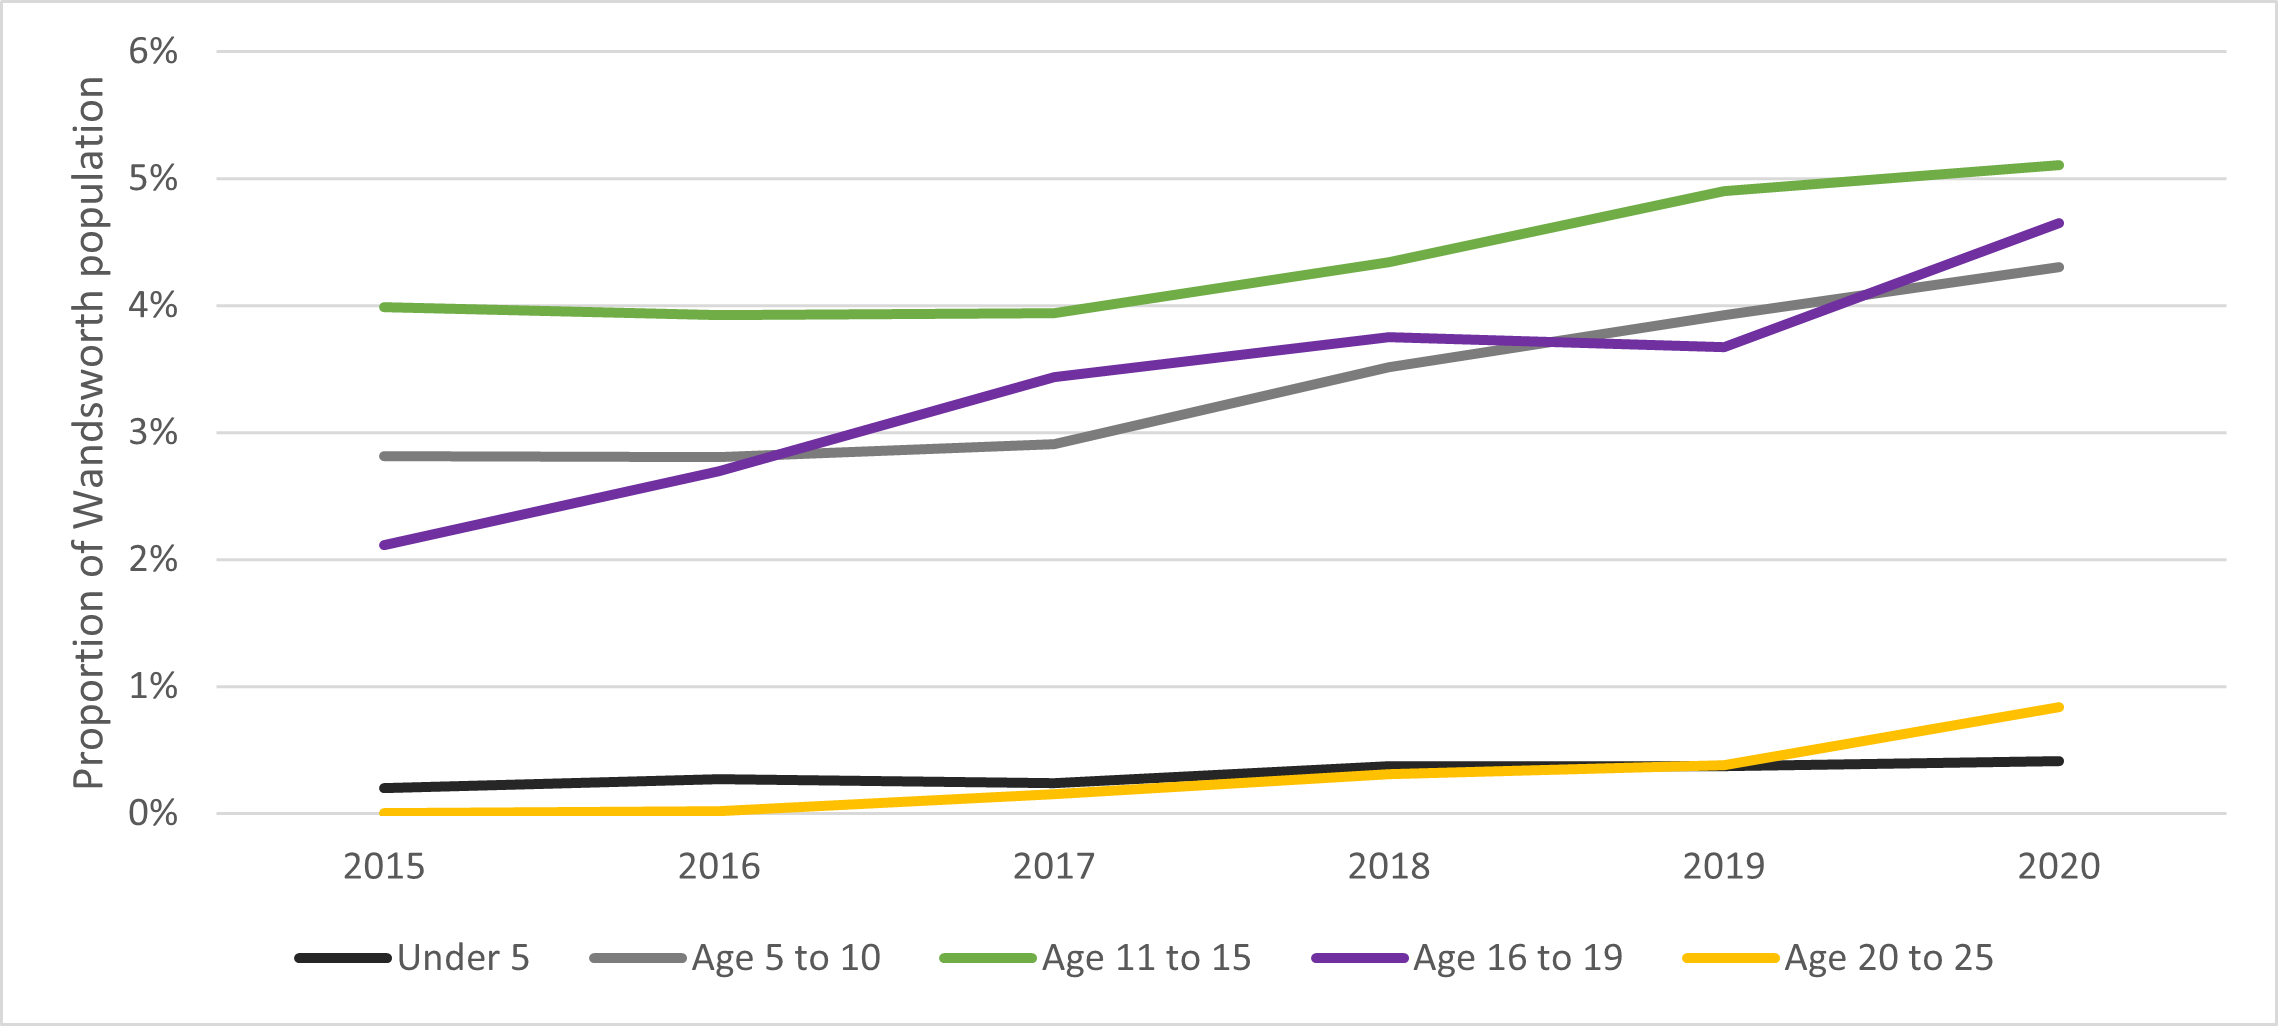
EHCPs as a Proportion of the Population in Wandsworth, 2015–2020

Source: Population projection Estimates from GLA data February 2020 and EHCP figures from SEN2 SFR

72% of children and young people in the borough with EHCPs are male, 30% are female. 69.6% with EHCPs are from a Black Asian and Ethnic Minority background. The largest (minority) group are Black or Black British, accounting for 25.5% of children and young people with EHCPs 98. This shows that whilst Wandsworth has a high proportion of EHCPs, there is a significantly high level of need amongst males and those of Black ethnicity.

The high proportion of males with EHCPs is a common trend at a national level. Higher prevalence in young males may be due to biological vulnerability to disability that affects their learning, either from birth or as they develop. More young males experiencing difficulty with their education are identified as having SEND than young females, due to their propensity to act out and display hyperactive, impulsive, or disruptive behaviour 99.

Another measure of need in is the number of people in receipt of Disability Living Allowance (DLA) or Personal Independence Payments (PIP). This is a slightly different cohort of people as some of these people may not have an EHCP. The number of young people in receipt of DLA or PIP has increased by 34% from 1,920 in 2011 to 2,566 in 2018. In 2019 there were 1,849 children aged 0-15 years, and 192 young people aged 18-24 years receiving DLA. In April 2019 there were 637 young people aged 16-24 years in receipt of the PIP.

The number of adults aged 18-24 years with learning disabilities in Wandsworth is projected to increase by 17% from 681 in 2017 to 799 in 2035. The prevalence of learning disabilities among this age group is predicted to grow more rapidly than all other age groups. The total number of adults with learning disabilities aged 18-64 years is projected to increase by 9% over the same period. This has implications for the level of demand with regard to EHCPs in the borough, as well an increasing level of need in the 18–24 year olds.

SEND Support

In January 2020, there were 5903 pupils with SEND in Wandsworth, 13.2% of all pupils. This number is slightly up from 5741 (12.8%) in 2019 but has remained with 5842, (13.4%) in 2016 100. Wandsworth has a slightly higher proportion of pupils on SEND Support than the national average of 12.1%. There is significant variation in these figures amongst schools, some may be due to over identification of SEND. According to the latest school census data (January 2020), pupils with SEND Support were nearly twice as likely to be boys than girls (64% compared with a 35%).

14.5 Prevalence of Areas of Need

The prevalence of different types of need nationally is measured annually by the DfE. Data collections report on the primary needs of pupils with special educational needs and/or disability within state-funded schools. Changes and disparities in diagnostic practices over time mean that longer term trends are less reliable. Key trends from national data set include:

  • a reduction in the proportion of pupils with specific learning difficulties and moderate learning difficulties
  • an increase in the proportion of students with autistic spectrum disorder since 2015
  • an increase in the proportion of students with speech, language and communication needs since 2015.

These trends are also visible in the Wandsworth dataset. The decrease in pupils with moderate learning difficulty (MLD), and the increase in pupils with autism spectrum disorder (ASD) are more pronounced. These datasets only indicate the primary need, a shift from MLD to ASD does not preclude co-morbidity.

As shown in the table below, the most prevalent primary types of need in Wandsworth are speech, language and communication needs (SLCN) at 26.7%, SEMH at 20.4% and ASD at 13.8%, above the England average for all three categories.

Source: PANSI LD – Baseline estimates

The Family Resources Survey (FRS) 101 captures prevalence data regarding the different types of impairment that children aged 18 years and under have in the UK. Data from this survey cannot be compared directly with Department for Education (DfE) data as the age ranges are different. The FRS allows for multiple impairments whereas the DfE data only includes primary types of need, using different classifications. However, both surveys indicate similar trends including:

  • sensory and physical needs are becoming less prevalent, most notably stamina, breathing, fatigue and hearing impairments
  • the prevalence of social and behavioural needs has increased by 24% since 2012/13
  • the prevalence of learning disabilities has increased by 19% since 2012/13.

Hearing, Visual, Multi-sensory Impairments

Despite data suggesting decreasing prevalence in sensory and physical needs in the UK, Wandsworth has the highest proportion compared with the statistical neighbours of pupils with hearing impairments, 3.1% compared with 1.8% nationally. The incidence of visual impairments in Wandsworth is 2.3% compared with 1.0% nationally. The number of pupils with multi-sensory impairments as their primary need is 0.6% compared to 0.3% nationally. Wandsworth is also the second highest nationally for the proportion of pupils with visual impairments Table 12.

Wandsworth has two specialist schools, two resource bases and a sensory support service for these types of impairments which might explain the significant proportion of pupils in comparison with national and statistical neighbours. Nevertheless, it represents a high level of demand which must be met by the local authority.

Autism Spectrum Disorder (ASD)

In 2020, 13.8% of pupils with SEND had ASD as their primary need compared with 11.9% nationally. Since 2016 there has been a 3.6% increase in the proportion of the school population with ASD as their primary need compared with a national increase of 3.1%. The increase in prevalence is not unique to Wandsworth. In common with other local authorities, Wandsworth is experiencing a significant growth in children and young people identified with ASD receiving services from 161 in 2001 to 1406 in 2018/19. There are now more than 1 in 50 children aged between 7-15 years identified with ASD and receive specialist services. This is significantly higher than rates quoted by the National Autistic Society of about 1.1 in 100 102, representing a significant level of need in the borough.

In light of the increasing ASD diagnoses and consequent significant impact of demand for assessments, intervention services, and special school places, a review of the ASD Pathway in Wandsworth was conducted. It found that parental satisfaction with the level of support and/or training offered was largely below 50%.

63% of parents answered that they had come across difficulties when accessing support services, notably long waiting lists for therapy services, the inflexibility of training courses, and difficulty in accessing CAMHS support. Following consultation on restructuring the pathway, which was largely supported by respondents, proposals were put forward to and agreed by the Council Executive in July 2019. Proposals are being implemented, with changes reflecting the concerns raised during the consultation phase. The impact of this is yet to be seen.

There is a Designated Medical Officer for the area, who has been closely involved with the review of the ASD pathway. The Special Education Needs and Disabilities (SEND) Code of Practice, states that partners “should ensure that there is a Designated Medical Officer (DMO) to support the CCG in meeting its statutory responsibilities for children and young people with SEND”. A service review was conducted into the role of the DMO due to increased demand on the role. Extra capacity has been provided but it is yet unclear whether this is sufficient to meet current demand.

Despite evidence of increasing ASD diagnoses, a study conducted by the National Autistic Society on challenges for families affected by autism in Black, Asian and Minority Ethnic communities found that families reported experiences of misdiagnosis or no diagnosis This was often because the child was just thought to have behavioural difficulties rather than ASD 103.

Social, Emotional and Mental Health Needs (SEMH)

As of January 2020, the proportion of pupils with SEMH in Wandsworth as their primary need is 20.4% of the total SEND population. This is above the national average of 17.8%. Wandsworth schools have the 21st highest proportion of pupils with SEMH nationally:

  • within state-funded primary schools the proportion is 18.8% in Wandsworth, compared with a 15.3% in London and 16.8% nationally
  • within state-funded secondary schools the proportion in Wandsworth is 25.9% compared with a 20.8% in London and 20.7% nationally
  • within special schools the proportion in Wandsworth is 12.4% compared with an 8.7% in London and 12.8% across England 104.

According to the local authority report for Wandsworth as part of the study on ethnic disproportionality in the identification of SEND, the Wandsworth unadjusted data showed Black Caribbean pupils were over four times as likely to be identified with social, emotional and mental health (SEMH) needs than the White British majority. They are also being overrepresented for Specific Learning Difficulties (SpLD), Moderate Learning Difficulty (MLD), Speech, Language and Communication Needs (SLCN), Autism Spectrum Disorder (ASD) and for any SEND. Whilst Black Caribbean pupils were generally overrepresented nationally, Wandsworth shows a particularly high level of overrepresentation 105.

The adjusted data (accounting for factors such as socioeconomic disadvantage, gender, birth season and year group) shows that Black Caribbean pupils were still two and a half times as likely to be identified as having SEMH needs than the White British majority and shows overrepresentation for all the aforementioned categories of SEND. Wandsworth showed the highest SEMH incidence in Black Caribbean and Mixed White and Caribbean of all local authorities nationally at 11.5%. Wandsworth also showed the 3rd highest incidence of any SEND in Black ethnic groups at 24.5%.

One proposed explanation for the overrepresentation of Black pupils with SEMH/MLD is inappropriate interpretation of ethnic and cultural differences. Alternatively, the disproportionality may reflect ethnic minority pupils experiencing substantially greater socioeconomic disadvantage relative to the White majority 106.

The findings for Wandsworth of the recently published study show that over-identification of SEMH among pupils from Black Caribbean and Mixed White and Black Caribbean ethnicities cannot be wholly explained by other factors associated with high levels of SEMH (e.g., deprivation, socioeconomic disadvantage), suggesting that racial biases may be leading to the over-identification of this type of need amongst this demographic. There are long term trends indicating that some schools over identify this type of need and this will need be monitored on an ongoing basis 107. These disparities reflect wider research that has demonstrated links between certain types of need and ethnicities across local authorities nationally, which may be reflective of misidentification of need.

This evidence makes clear that there is a danger that ethnic disproportionality, if not addressed, may lead to inadequate or inappropriate provision, and perpetuate unequal outcomes.

Speech, Language and Communication Needs

In Wandsworth, 30.8% of SEND Support pupils had speech, language and communication needs as their primary need, compared with a 23.7% nationally 108.

Nationally, of those pupils with speech, language and communication needs, 25.9% of them have a first language other than English (January 2020) 109. In Wandsworth, as calculated internally using the January 2020 school census, this is almost double at 49.1%. However, it should be considered that Wandsworth has a much higher percentage of pupils who are classified as having English as an additional language (EAL) with 43.4% in primary schools and 42.5% in secondary schools, compared with a 21.2% and 16.9% nationally.

It is important to note that when a child who is learning English as an additional language makes slow progress in school, it is sometimes difficult to tell whether the delay is caused because they are not confident using the language or because they have a specific learning difficulty independent of the language. Educational psychologists provide an essential role in the assessment of the distinction between language learning needs and special needs.

As schools record needs, schools must be mindful of how they record speech, language and communication needs in EAL pupils to make sure that it is an actual need each time. The importance of being able to discriminate clearly between the need for EAL support and the need for SEND Support is readily acknowledged by teachers. But it is also widely recognised that, in practice, distinguishing between a language learning need and a special educational need is a difficult task 110. The SEND Code of Practice recommends that very careful consideration be given to the identification and assessment of the special educational needs of pupils whose first language is not English. It highlights the need to consider the context of the home, culture and community and, where appropriate, take advantage of any local sources of advice and liaison arrangements within the relevant ethnic community.

Lack of careful consideration may lead to misidentification of need or misdiagnosis by assuming the child has a learning difficulty as opposed to a language or cultural barrier. Assumptions about a child’s expected language ability may also delay diagnosis. It may be interpreted a child’s delayed development and speech is due to them speaking another language.

Attainment – Education, Employment and Training

Generally, in Wandsworth there is evidence of good educational outcomes for those on SEND Support. However, positive outcomes are not always shared among those with EHCPs. In 2019, 37% of the pupils receiving SEND Support achieved the expected standard in reading, writing and maths at the end of Key Stage 2. This is significantly higher than the national average of 25%, and the statistical neighbour average of 36%. For those with an EHCP however, only 6% reached the expected standard, lower than the national average of 9%, and statistical neighbour average of 13% 111. However, as Wandsworth has a higher proportion receiving SEND Support, one could assume a possibility that these good results may in part be due to an overidentification of need.

Issues concerning timeliness of issuing new EHCPs could be a cause of lower than average attainment. The 0–25 year old SEND Code of Practice states the whole process of EHC needs assessment and EHCP development, from the point when an assessment is requested (or a child or young person is brought to the attention of the local authority) until the final EHCP is issued, must take no more than 20 weeks. In Wandsworth in 2019, 45.4% of new EHCPs were issued within the statutory 20 weeks 112. EHCP timeliness remains an ongoing issue across many local authorities. Nationally the number of EHCPs issued within 20 weeks fell from 64.9% in 2017 to 60.4% in 2019.

There have been significant improvements in Wandsworth since 2015 when the achievement rate was 28.7%. However, the current rate still sits below this national average as well as our statistical neighbour average of 74.1%. This will continue to be a priority for the Council.

Looking at the outcomes of the EHCP cohort resident population in January 2019, the percentage of children and young people with EHCPs attending post-16 institutions in Wandsworth was 10.4%. This is below national (16.2%) and London (13.6%) averages 113. The percentage of 19 year olds in 2018 with a statement or EHCP qualified to level 2 including English and maths (14.1%) was below the London average (16.4%), and the national average (14.8%) 114. However, the proportion of young people with EHCPs who were not in education, employment and training (NEET) improved in 2018/19 and is now better than average as 4th highest amongst statistical neighbours, and 19th highest nationally.

Absence and Exclusions

There is a relatively high percentage of persistent absentees in special schools in Wandsworth, at 30.7% compared with 30.1% statistical neighbours, and 28.1% England 115. This is a dramatic decrease from 35.4% in 2018. It is important to note the definition of persistent absence used by the DfE is “pupils missing 10 percent or more of their own possible sessions (due to authorised or unauthorised absence) are classified as persistent absentees”. This means children who are frequently too unwell to go to school (authorised absence) are counted in this measure. It may be interesting to see what proportion of persistent absences have an impact on the inflated figures (table below).

The fixed-term exclusion for the academic year 2018/19 across all schools in Wandsworth was 6.2% for SEND Support pupils, and 7.6% for those with an EHCP, down from 7.1% and 9.6% respectively in 2017/18. Wandsworth now has the lowest rate amongst statistical neighbours. Despite this, we are aware of children who have been off-rolled and who are on reduced timetables require attention.

As shown in the table below, fixed term exclusion rates for pupils with SEND are considerably higher than for pupils with no SEND and have increased from the previous year in all categories. These figures are much lower than the national average. The fact that pupils with SEND are consistently excluded more often than their peers needs to be addressed, particularly to see if they can be given more support which may help keep them in school.

Both for EHCP and SEND Support, it is notable the rate of pupils who have had at least one fixed term exclusion is lower in Wandsworth than the national average. In 2018/19, the permanent exclusion rate for both EHCP and SEND Support pupils was lower in Wandsworth than nationally.

Transition to Adulthood

In 2020, according to data held within the Disability Team for 0–25 year olds, there are 144 0–17-year-olds and 192 18–25-year-olds in the service. The considerable projected increase in number of adults aged 18-24 years with learning disabilities means there could be more demand on transition services in the coming years.

All young people within the 0–25 years Disability Team are eligible for an assessment under The Care Act (2014) 116. A transition assessment is carried out where it is likely the young person will have care or support needs after they turn 18 years old. This is highly likely to be the case where the young person is currently in receipt of children’s services for their disabilities. For young people with SEND the assessment should inform a plan for the transition from children’s services to adult care and support.

Those young people outside of the 0–25 years team, for example managed by other teams in children’s services, children in need or looked after children, are referred to the Transitions Panel so that their pathway can be planned jointly by Children’s and Adults’ Services. The Transitions Panel service has recently been reconfigured leading to challenges in performance tracking including predicting future needs at 18 years old. This is being addressed as a priority. The identification of SEND also appears lower than expected for those that are subject to child protection plans. This has led to a higher than expected referral rate to the Transitions Panel.

Transition planning for care leavers with complex needs into adult services continues to be a challenge with some young people not receiving the support they need in a timely or well-planned manner. Under the Care Act 2014, and Section 16 of the Statutory Guidance 117, the CCG is required to support the local authority in the transition to adult services. Children’s Continuing Care must alert the appropriate services when the young person is at the age of 14 years and a decision should be put in place in principle by the age of 17years so that Adults’ Continuing Healthcare commences immediately when the young person turns 18 years old. Transition planning at the age of 14 years is challenging to achieve due to high demand, can lead to additional pressures on Adult’s Continuing Healthcare, and disruption in packages of support. Entitlements for under 18 years for support is often greater than that provided by Adult Services.

A Transitions Officer role created within CAMHS has the principal responsibility of strengthening transition pathways into adult services. Transitions are also supported through the local authority contacting parents and carers with children on the Disabled Children’s Register (DCR). They inform them of the transitions process well in advance of their 18th birthday. This has proven to be very effective as there is evidence of a peak in referrals in the months when letters are sent.

Unidentified and Unmet Areas of Need

Part of addressing need is identifying areas where there are unidentified needs amongst children and young people. There are however processes in place, or being put into place, which may help us to identify this unmet need in children and young people with SEND. For example, the Disabled Children’s Register can be used to capture areas of need. It collects information on children and young people in the borough with a physical or learning disability which can be used to help the local authority with the identification of needs.

There are other areas of need listed below:

Children and Young People with Attention Deficit and Hyperactivity Disorder (ADHD)

One of the categories of need which is not being met sufficiently being met is children and young people with attention deficit hyperactivity disorder (ADHD). One of the main issues is that ADHD is not recorded as a primary need, instead being recorded under the primary need of SEMH or ASD. This can lead to unmet need because the services and support provided for children and young people with SEMH, ASD or ADHD may be quite different. Furthermore, as ADHD is not recorded as a primary need, the exact number children and young people with ADHD is unknown. There is also an impact on education as we are aware that many pupils diagnosed with ADHD are not in schools, may have been excluded or are in a Pupil Referral Unit (PRU), finding it hard to get a place back in a school. According to latest national school census data on attendance for the academic year 2017/18, pupils with SEMH needs account for the 2nd highest proportion of overall absences at 9.3%, the highest proportion of unauthorised absence of any category. Furthermore, pupils with SEMH account for the 3rd highest proportion of persistent absentees at 27.6% (table below).

The fact that ADHD is not recognised as a primary need in itself, means that children and young people with ADHD are potentially not getting enough of the right type of support, which not only affects their health, but can have an impact on their education. Further consideration must be given to the specific support required by these children and young people.

High-functioning Autism Spectrum Disorder (ASD)

There is a significant proportion of children and young people with high-functioning ASD who are out of school or are educated in independent placements, due to their anxiety, SEMH or ADHD needs. The fact they are unable to attend mainstream secondary schools suggests there is an unmet need.

School Absenteeism

One of the potential explanations for high and persistent absentee levels in special schools may be because authorised absences are for those who are too unwell to go to school. Some children in specialist provision are frequently too unwell to go to school, whether this be mentally or physically. Medical needs can impede school attendance and affect educational attainment. There is a potential gap in relation to providing education at home.

Mental Health Support Process/Care, Education and Treatment Reviews (CETR)

CETRs are focused on those children and young people who have either been or may be about to be admitted to a Specialist Mental Health/Learning Disability Hospital. CETRs are not always conducted which means health needs are not addressed as a consequence of problems and delays in the process.

SEND Support Guidance

Many local authorities have produced guidance on SEND Support within schools. Wandsworth guidelines on SEND support are being reviewed as part of the SEND Support subgroup of the SEND Strategic Partnership Board Of course, all schools are different and there is variation in the number of pupils with SEND Support across schools. As laid out in Part 3 of the Children and Families Act 2014, a child or young person has SEND if they have a significantly greater difficulty in learning than most others of the same age. In some schools, quality-first teaching means schools can manage need and therefore is representative of a low level of SEND Support, whereas in other schools there may be a particularly high proportion of pupils receiving SEND Support, potentially due to overidentification. Some clearer consistency on what is generally classed as a special educational need may benefit schools to combat instances of over- or under-identification.

14.6 Service Response to Need

Education , Health and Care EHCP Assessments

Despite improvements in timeliness for issuing EHCPs, it remains below national and statistical neighbour averages with timeliness standing at an average of 45.4% in2019. In the same year, 98.4% of EHCP assessments in Wandsworth resulted in a plan being issued. National expectations in relation to achieving timeliness does not account for the high and rising demand in need. The quality of EHCPs in Wandsworth is assessed as part of the termly multi-agency audit report sent to the SEND Strategic Partnership Board.

Access to Primary Care

Parents and carers were consulted in relation to areas for improvement for access to primary care. Recommendations included reducing waiting times, and redesigning waiting areas and spaces to meet the sensitive needs of children with SEND. Recommendations from the consultation are currently being implemented by the DCR Wandsworth Team, including training with GP Practice managers and CCG GP leads.

Nursing Provision in Special Schools

A review of the appropriateness of current commissioned arrangements for nursing provision in special schools has been undertaken across the borough to ensure children’s health needs are effectively met and recommendations are implemented.

14.7 Data Limitations

The following limitations with SEND data are apparent:

  • identification and recording of SEND is a subjective process, meaning data cannot always be taken at face value. For example, there is variation in the identification threshold, across schools and local authorities, with some overidentifying, and others under identifying individuals
  • identification of need is often established through service demand, as opposed to actual prevalence, which means using solely service level data analysis can misrepresent the scale of need in the local population.
  • need is also compounded by data quality issues across children’s services meaning that data can only be used as a proxy measure of current and predicted need
  • variations also exist between datasets in terms of the categorisation of needs, and consideration of primary or multiple needs
  • this can make it difficult to map trends in access to and provision of services across the population of children and young people with SEND
  • care is required when interpreting data to ensure that a consistent population is used for comparison
  • some datasets and secondary analyses consider borough residents, others consider pupils attending schools in the borough who may or may not be residents
  • some datasets include all school types, others just state funded primary and secondary schools (i.e., excluding special schools)
  • where different populations or timescales have been used, or information is not held, comparisons become challenging
  • needs are individual and often complex, meaning children are known to multiple services
  • information about their needs may be categorised or prioritised differently depending on the service they are accessing
  • data is often held in different and incompatible systems which creates a challenge in bringing them together to create a full picture of need
  • high levels of cross London migration among the 20-24 years age group means data can be distorted and incomplete.

14.8 Current Services and Good Practice

Children and young people with SEND and their families face distinct and challenging issues that require a range of dedicated and specialist responses from public services. The full range of local services is detailed on Wandsworth’s Local Offer website. The aim of the website is to provide advice and information of the range of services and options available for children and young people with SEND. Below is a list of available of support services:

Annual Health Checks

Annual health checks for people with learning disabilities have been introduced to reduce health inequalities. Anyone aged 14 years or over who is on their GP’s Learning Disability Register can have a free health check once a year. You can ask to go on this register if you think you have a learning disability, you do not need to be diagnosed with a learning disability. All GP surgeries in Wandsworth offer annual health checks if there is evidence of a learning disability.

Autistic Syndrome Disorder (ASD) Pathway

Currently ASD assessments are led by paediatricians at St George’s Hospital when a child is below the age of 8 years, and by clinical psychologists from specialist CAMHS services when a child is older than 8 years. The child is then referred to specialist services where appropriate, and parents are signposted to support and training.

A review and refresh of the ASD pathway has been conducted to ensure service models for assessment, diagnosis and intervention are effective across the age range. The review aimed to clarify waiting times and active early interventions offered prior to full diagnostic assessment, including piloting new approaches to triage and support.

CAMHS Access Service

South West London and St George’s Mental Health Trust are commissioned by Wandsworth CCG to deliver the CAMHS Access Service. It acts as a single point of access to CAMHS for children and young people up to the age of 18 years who are registered with a Wandsworth GP.

The local authority provides Access Family Consultancy as part of this service. These are joint sessions where young people, their parents and carers can identify and discuss which issues are having an impact on their family well-being.

CAMHS Plus

CAMHS Plus supports the transition from child to adult mental health services for young people aged 18 years and over. Transitions across the system of care is a significant and essential component of the transition planning process for young people who are involved with multiple agencies across the health, education and social care sectors.

CAMHS Under 5 Service

The local authority commissions a CAMHS Under 5 Years Team who are embedded in children’s centres and work closely with health visiting and GP services. The service offers 1-2-1 and group sessions to under 5 year olds and their families. Referrals can be made by GPs, health visitors, nurseries and other professionals working with the children.

Child Development Centre at St George’s Hospital

The Child Development Centre (CDC) has specialist services such as physiotherapy, psychology, and speech and language therapy, paediatric neurodevelopment, neurodisability and epilepsy services. These services run clinics at St George’s Hospital, and provide outreach services at regional hospitals or centres such as the Early Years Centre.

Children’s Occupational Therapy Team

The children’s occupational therapy service is focused on enabling children aged 0-11 year olds to participate in daily activities to improve their independence and well-being. The service works with children who are unable to do daily occupations due to illness, disability, family circumstances, or as a result of changes as they get older. The service can provide assessments and advice if access to certain buildings or places in the community is problematic, and it assists and advises schools on ensuring their facilities are accessible for children with disabilities.

Community Health Services Commissioned by the CCG
  • Children’s neurodevelopment and neurodisability paediatric service, including autistic spectrum disorder diagnosis pathway and other specialist assessment and diagnosis

  • Children’s therapies are provided in the community and schools, including speech and language therapy, occupational therapy, physiotherapy, and children’s community nursing.

Community Learning Disability Health Team (CLDHT)

The Wandsworth Community Learning Disability Health Team is a specialist multidisciplinary team that provides health services for adults (aged 18 years and over) with learning disabilities who have difficulties accessing mainstream health services. To access this service individuals can self-refer or be referred by a carer, parent, partner or health practitioner. To ease the transition process, the Community Learning Disability Health Team undertakes assessments with young people before their 18th birthday so that the assessment will be ready in advance. A number of young people with SEND still have their needs met past 18 years of age by their school or college, the CLDHT is available where this is not the case.

Community Paediatric Physiotherapy Team

The Community Paediatric Physiotherapy Service provides high quality physiotherapy for children and young people aged 0-15 years old who have musculoskeletal issues, developmental delay, and complex physical needs. They form part of the EHC assessment process and will advise the Special Needs Assessment Service (SNAS) teams on what types of provision is needed for the schools. The team aims to maximize the child’s potential in helping them access the national curriculum at a similar level to their peers. They do this by suggesting alternative ways of performing or structuring activities within the school environment and at home. Outcomes are decided with the child and their parent or carer, and are met through 1:1 treatment sessions, training for parents, guardians and school staff, and the provision of specialist equipment.

Contact

Contact is a charity commissioned by the local authority to provide advice and support to SEND children and young people and their families It runs local and online groups that help families support each other and assist families to campaign and fundraise to develop and shape local services. Family support workers are available to children aged 0 to 13 years old and their families. Families are assigned to a support worker depending on where they live in the borough.

Disability Access Fund

The Disability Access Fund is available for children aged 3 or 4 years old in receipt of Disability Living Allowance (DLA). It is a one-off payment of £615 to the provider for resources, equipment and adaptations which improve inclusion.

Early Support

The Early Support Service assists the families of children aged 0-5 years old with complex medical needs through an assisted or designated key working stream. Assisted support involves regular check-ins with a member of the team and the opportunity to access drop-in sessions. A key worker is assigned to the family and liaises with professionals supporting the child to arrange the Team Around the Child (TAC) meetings or assist with appointments and home visits.

Early Years Speech and Language Therapy Service

The Council commissions a Speech and Language Service to undertake early identification and therapeutic support through children’s centres. The service is designed to be flexible and comprehensive so that the therapist sees a child and their family at the right time, in the most appropriate setting.

Educational Psychologists

Educational psychologists are part of the Schools and Community Psychology Service (SCPS) service listed above. They work with children aged 0–25 years who may need SEN Support or are placed at SEND Support (if school age) as part of an education, health and care needs assessment (EHCNA), or those who have EHCPs.

Get Set Go

Following consultation with young people, Get Set Go was set up by Wandsworth Council and South Thames College as a forum to showcase opportunities for employment, education, training and independent living. These events take place annually to support young people aged 14 -25 years in preparing for adulthood.

Health Visiting Service

The Health Visiting Service has been provided by CLCH since January 2018. It provides a universal support and advice service to all Wandsworth resident children aged 0-5 years old and their families. They promote health, assist in the early identification of development and health needs, prevent accidents, and ensure immunisations are completed. They also run a targeted health visiting service for children and families who require extra support. This service assesses each child and family and introduces them into appropriate services, such as speech and language therapy.

Mainstream Schools and Resource Bases Speech and Language Therapy Service

The school age service provides an assessment and intervention service for children in Reception and Years 1 to 11 in Wandsworth maintained schools. Every mainstream school within the Borough has a named speech and language therapist. The therapist provides support and therapy to children in school settings and educates staff to provide intervention guided by a speech and language therapist or speech and language therapy assistant (SLTA) and use strategies recommended, modelled and explained by the speech and language therapist. Three resource bases within the borough also commission the service (Smallwood, Tooting and Southmead). Speech and language therapists are located within these resource bases working closely with the staff and children.

Mental Health Trailblazers

Mental health trailblazers are being developed as part of the government agenda to tackle mental health needs in children and young people. This involves establishing new Mental Health Support Teams to develop models of early intervention, and to support staff in schools and colleges. There is a trailblazer in a cluster of schools in Southfields and a new one developing across a Battersea cluster. South Thames is also part of a further education college trailblazer.

Paddock School Based Therapy Team

The Paddock School Therapy Team takes an integrated approach to therapy and learning with the class team, families, and therapists, working together to set joint goals. The service aims to enhance future provision by expanding the range of tools being used to capture the pupil’s voice including observation of behaviour, talking mats, inclusion and belonging surveys.

PATHS

Promoting Alternative Thinking Skills (PATHS) is an evidence-based programme which takes place in the most deprived schools in Wandsworth. The programme helps reduce incidents of aggression and violence and exclusions.

Personal Budgets

The SEND reforms have enabled greater personalisation of support including the use of a personal budget. Children, young people and their families have greater choice and control over the design of the health, social care and education package. The personal SEND budget is a sum of money made available by the local area at the request of a parent or young person. It is allocated on the basis it would not be possible to meet the child’s needs without additional funding.

Place2be

Place2Be services are commissioned by Wandsworth CCG, operating within primary schools in Wandsworth. They deliver a range of services for 5-11 year olds including 1-2-1 counselling sessions, group work, teacher training, parental support and Place2Talk lunchtime sessions. Place2Be’s aim is to deliver therapeutic services that meet the emotional and behavioural needs of children and improve their well-being.

Portage Service

Wandsworth Portage is a home-based early education service for pre-school SEND children and their families. Portage provides weekly or fortnightly visits to provide activities and ideas to help each child develop. It supports parents to monitor their child’s progress and development as well as providing them with emotional and practical support. It also assists with transitional arrangements as the child approaches school age. The team collaborates with therapists, health visitors and educational psychologists, to develop activities to stimulate each child’s development.

Pre-School Specialist Speech and Language Therapy Service

This service is a Specialist Assessment and Therapeutic Service working with children with complex developmental and communication needs. Children receive intervention from 2 years until the term they start school. However, children are seen up to 8 years of age as part of a multidisciplinary assessment for possible autistic spectrum disorder. Children are seen within a range of clinical settings as well as their nurseries and schools. Speech and language therapists work with children with a hearing impairment up to the age of 18 years.

Resource Bases

The Council has worked collaboratively with a range of schools to set up bases to meet the needs of the increasing number of children and young people diagnosed with ASD, as well as existing speech, language and communication needs, MLD and hearing-impairments. It has also collaborated with South Thames College to open a base for pupils aged 19 years + with complex needs (Aurora) at its Merton Campus. There are currently 16 resource bases in the borough.

Wandsworth Autism Advisory Service

The new Wandsworth Autism Advisory Service works closely with partners across the authority to provide a planned and graduated support to parents and families of children with a diagnosis of autism, and those on the specialist pathway. The service provides specialist advice and support for parents and will upskill families through a bespoke and differentiated parent and carer training programme.

Wandsworth Sensory Support Service

Wandsworth Sensory Support Service (WSSS) caters for children and young people who have hearing and visual impairments, as well as those with complex needs. WSSS comprises Linden Lodge School and Wandsworth Hearing Support and Vision Support Services.

WAND/Wand+ Card

The WAND Card Scheme was introduced in 2013 to increase the proportion of children registered on the Disabled Children’s Register (DCR). The WAND Card can be used as a form of ID for children with SEND and allows access to a number of offers with local businesses and services. The WAND+ card is for young people aged 18-24 years old with special educational needs, disabilities or complex health needs. Full details of the offers, events and deals for WAND card holders can be found on the Local Offer website.

Specialist Youth Services

As well as a range of Youth Clubs which welcome children and young people SEND, the Council commissions youth Groups in Wandsworth specifically for young people with SEND. They include the Unique Youth at the George Shearing Centre, Generate, the Lady Allen Playground and Baked Bean.

Speech and Language Therapy ‘Talk Shops’

Parents and carers can self-refer to this service, and open access drop-in sessions are run regularly within children’s centres. A basic assessment may be conducted during these sessions and children can be referred for a full assessment. Parents are provided with age appropriate advice, support and information. For 0–3-year-olds, “Support for Little Talkers” workshops for parents have also been introduced.

Schools and Community Psychology Service (SCPS)

The SCPS delivers a number of different services across education, health, and social care settings to promote the positive development and well-being of children and young people. Consultation, advice, assessment and intervention are offered on:

  • children’s learning and development
  • social and emotional needs and behaviours
  • psychological well-being and mental health
  • parenting.

The service works with children, young people, their families, schools and other professionals, using applied psychological theories and approaches to analyse and help make sense of real-world situations and complex problems, and ensure a coordinated approach. The service has expertise in research, evaluation, training and supervision. It also offers critical incident support to schools when there has been a significant event affecting the emotional well-being of pupils and staff.

Supported Internships

Supported internships are a structured study programme based primarily with an employer. They are unpaid and last for a minimum of six months, and normally for a year. They are usually 20 hours per week. Wherever possible the young person will be supported to move into paid employment at the end of the programme. Alongside their time with the employer, young people complete a personalised study programme which includes the chance to study for relevant substantial qualifications and English and maths.

SEND Inclusion Fund

The SEND Inclusion Fund is available to ensure that 3 and 4 year old children with additional needs can participate fully in activities in early education settings. The fund is payable directly to providers. Additional needs may include a physical, sensory or learning disability, or difficulties in areas such as communication, attention and behaviour.

Short Breaks

Short Breaks give parents and carers of SEND children and young people the chance to have a break from their caring responsibilities. The local area offers a wide range of short breaks for children with disabilities, ranging from support for families to spend time together, to targeted support (wherever possible accessed without the need for an additional assessment), through to specialist services accessed through a social work assessment.

Wandsworth Information, Advice and Support Service (WIASS)

The Wandsworth Information, Advice and Support Service (WIASS) provides confidential and impartial information, advice and support for SEND children and young people aged 0–25 years, their parents and carers, to make informed decisions.

Core services include a telephone and email service, casework support, face to face meetings, outreach work, school/college/training providers visits, information and advice leaflets and templates. Local authority and Positive Parent Action events as well attendance at WIASS network regional and national meetings, and training events.

Special Schools

Wandsworth Borough Council maintains five special schools, three of which are regional providers with residential provision catering for children from across London and Southern England. A sixth school (Nightingale) became an Academy in October 2016 as part of the Orchard Hill College Academy Trust. Linden Lodge became an academy, with the Southfields Multi-Academy Trust in September 2018.

Specialist CAMHS Service

This is a multi-disciplinary service providing a specialised service for children and young people with severe, complex and persistent mental health disorders. It provides a comprehensive Tier 3 assessment and treatment service.

Travel Assistance

A variety of travel assistance is provided for some children with EHCPs whose and includes mileage reimbursement, personal travel budgets and travel training. Travel Assistance Budgets (TABs) allow parents and carers to independently arrange the best way to get their child to school, in a way that is convenient for them. The provision of travel training enables the development of young people’s skills and confidence to use public transport and allows them to become more independent. Travel training is available for secondary aged young people who have been assessed as being ready and able to begin learning to travel to and from school independently.

Wandle Early Years Hub

Young people in Merton and Wandsworth benefit from an Early Years Hub, funded by the Mayor of London’s Office. The Wandle Early Years Hub is one of only three across London. It works to improve the take up of free provision for eligible 2 year olds, improve provision for the most disadvantaged children, and improve early intervention for children with SEND.

West Hill Enhanced Children’s Centre

The Enhanced Children’s Centre is a specialist setting supporting all families in Wandsworth with children aged 0-5 years old with a disability, special or complex medical need. The centre provides services to children aged 0-5 years and their families including play and learning sessions, therapy sessions and parent groups. The centre works closely with professionals and therapists, and CAMHS workers can use the centre to run drop-in sessions or targeted programmes of work. They run programmes on topics such as parent well-being, sleep, behaviour, feeding and sensory needs.

Workright

The Council employs a dedicated employment coordinator to liaise with local employers to develop supported employment and internship opportunities.

Youth Offending Team Screening & Assessment

All young people attending the Youth Offending Team are initially screened and assessed for speech, language and communication needs (SLCN), provided they have given their consent to pick up previously unidentified needs. A key challenge is differentiating mental health needs from SLCN.

14.9 Evidence Base and Good Practice

Early identification and intervention have been identified as crucial to improving the health and well-being of children and young people with SEND.

NICE Guidance implementation

NICE guidance on transition from Children’s to Adults’ Services includes recommendations on planning and carrying out transitions to help young people and their carers have a better experience of transition.

Key recommendations include:

  • involving young people and carers in service design, delivery and evaluation related to transition
  • ensuring transition support is developmentally appropriate
  • strengths-based transition support (focus on what is positive and possible for the young person rather than a predetermined set of transition options)
  • adoption of a person-centred approach
  • integration between health and social care managers in Children and Adult Services
  • planning for adulthood from age 13/14 years at the latest
  • identification of a named worker for each young person to coordinate their transition
  • local, integrated youth forums to provide feedback on existing service quality, and highlight any gaps
  • preparation for transition should start early.

As stated in the SEND Code of Practice, “When a child is very young, or SEND is first identified, families need to know the great majority of children and young people with SEND, with the right support, can find work, be supported to live independently, and participate in their community. Health workers, social workers, early years’ providers and schools should encourage these ambitions right from the start”.

Autism Spectrum Disorder (ASD)

NICE guidance (2013) 118 and (2017) 119 regarding ASD in under 19 year olds gives the following key recommendations:

  • set up a local autism multi-agency group with managerial, commissioner and clinical representation from child health and mental health services, education, social care, parent and carer service users, and the voluntary sector
  • improve early recognition of autism by raising awareness of the signs and symptoms through multi-agency training
  • ensure relevant professionals are aware of the local autism pathway and how to access diagnostic services
  • consider a specific social-communication intervention for the core features of autism in children and young people that includes play-based strategies with parents, carers and teachers to increase joint attention, engagement and reciprocal communication in the child or young person.

Service Design and Delivery

NICE guidance (2018) 120 covers services for children, young people and adults with a learning disability and challenging behaviour, recommending the adoption of a lifelong approach to supporting people, their families and carers, focusing on prevention and early intervention.

Social and Emotional Well-being: Early Years

NICE guidance on social and emotional well-being in early years 121 recommends adopting a life course perspective, recognising that disadvantage before birth and in a child’s early years can have life-long, negative effects on their health and well-being. Furthermore, a focus should be put on the social and emotional well-being of vulnerable children as the foundation for their healthy development, and to offset the risks relating to disadvantage.

Social and Communication Skills

A research report conducted by Coventry University 122 mentions SKILLS: targeting social skills including greetings and goodbyes, nonverbal communication, humour, conversation, perspective taking, emotions, and friendship tips. An evaluation of the intervention reported an increase in peer engagement and decreased isolation during playtime following sixteen 30–45-minute sessions held twice weekly.

Further reported is The Conversation Club curriculum which focuses on teaching participants basic skills identified as necessary for successfully engaging in a conversation. These include:

  • thinking about a conversational partner and remembering what they have said
  • selecting topics of mutual interest
  • maintaining on-topic conversation by asking follow-up questions and making comments
  • demonstrating active listening
  • using attention-gaining strategies to ensure partner is listening
  • repairing simple conversational breakdowns.

The Conversation Club curriculum is a nine-month programme where 14 lessons are repeated over a two-to-four-week period until participants acquire the target skill. Research evaluating the effectiveness of the Conversation Club curriculum reported increases in peer-directed interactions, the number of questions asked, use of strategies to introduce new topics, extended conversations on existing topics, and attempts at conversational repair. Some evidence for increased use of attention-gaining behaviours was also reported.

Engagement with Parents and Partners

Islington Clinical Commissioning Group 123 in partnership with the LA, have recruited and trained six local parents of children with SEND to enable them to undertake parent to parent consultation to inform local commissioning arrangements.

Consultations carried out so far have been to:

  • support a local review of autistic spectrum condition diagnostic pathways
  • gain parents’ views of local effectiveness in identifying and meeting the needs of children and young people with SEND.

East Riding of Yorkshire commissioned an external company to undertake an independent strategic review of the continuum of support, services and provision for children and young people aged 0–25 years with SEND. This included engaging and gathering feedback from a range of stakeholders, including young people, parents, carers and professionals across education, health and care services. The overall aim was to better understand how effectively the current range of SEND provision was meeting the needs of children and young people, the identification of gaps, and recommendations regarding how needs can continue to be met going forward.

Strength-Based Practice

A strength-based (or asset-based) approach focuses on individuals’ strengths including their personal and social assets and their community networks. It places the individual as well as their problems at the centre of the process, highlighting ‘what is strong, rather than what is wrong’. It helps to identify the resources within themselves, as well as the support they have around them. It ensures the individual’s strengths and talents are identified and considered in all interventions including what is important for them or what they would like to achieve. Adopting this approach from an early stage can be effective for children and young people with SEND as it gives them a positive outlook for their future.

Working with individuals through a strength-based approach is said to improve individual outcomes, such as quality of life, employment, and health. It promotes positive views of individuals and takes the focus away from blame or judgement. This may contribute to de-stigmatisation of certain groups including those with SEND.

Male Targeted Intervention

Future Men is a charity supporting boys and men, advocating for them through informing policy and practice and delivering targeted programmes and outreach work. Their work addresses some of the biggest societal issues such as low educational attainment, poor mental health, and youth violence. Males make up a large proportion of those children and young people with SEND in Wandsworth (and indeed nationally), so male targeted intervention and outreach work could prove effective. Disproportionate identification of SEND within Black ethnic groups, particularly Black Caribbean, is one of the most significant and long-standing issues in Wandsworth and nationally.
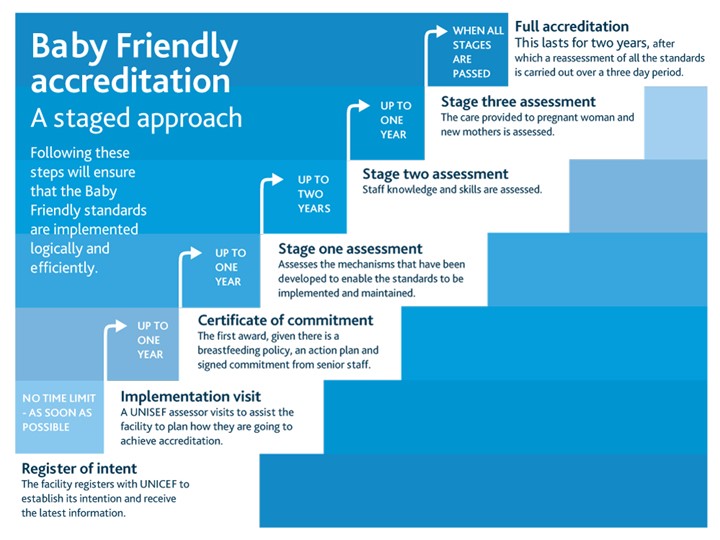
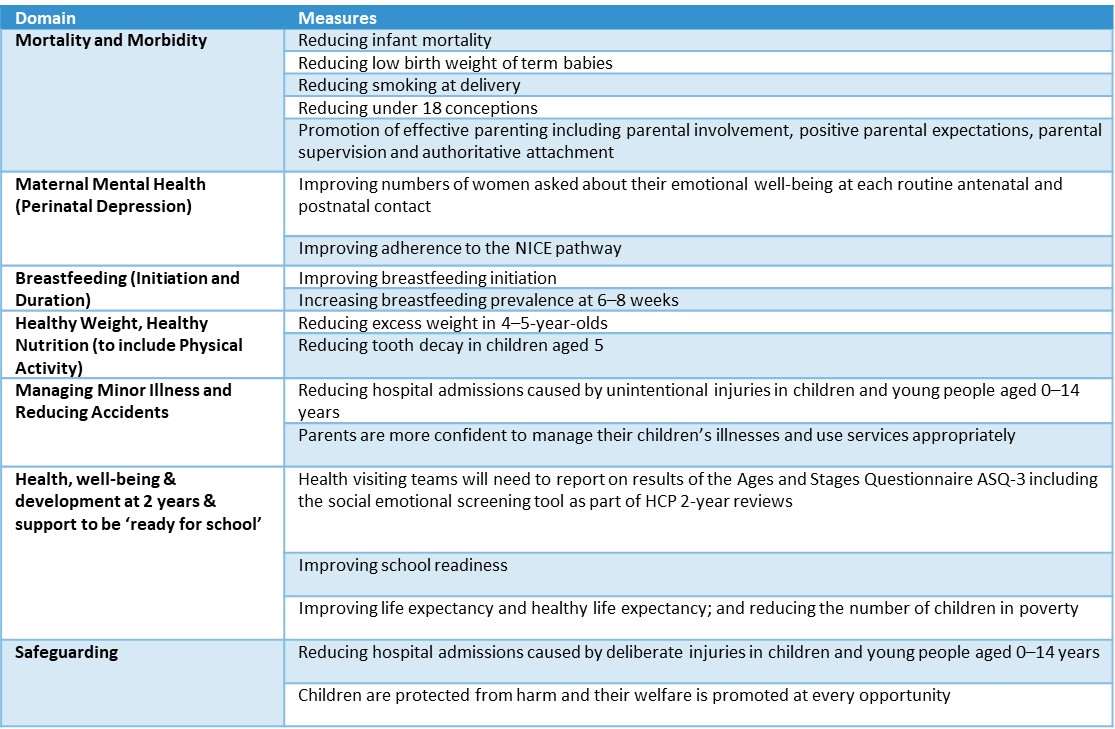
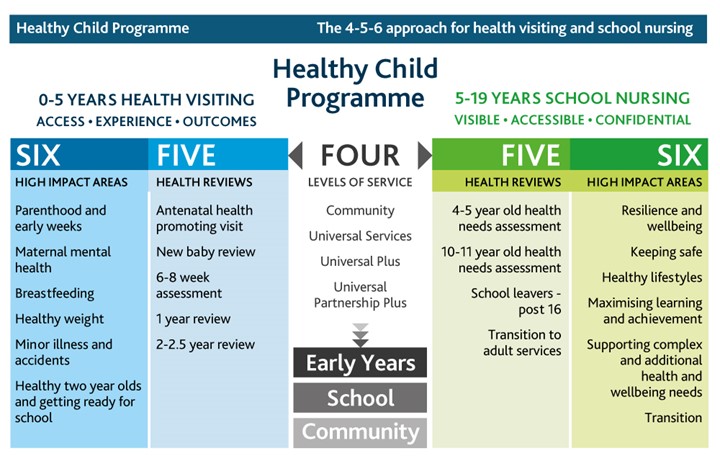
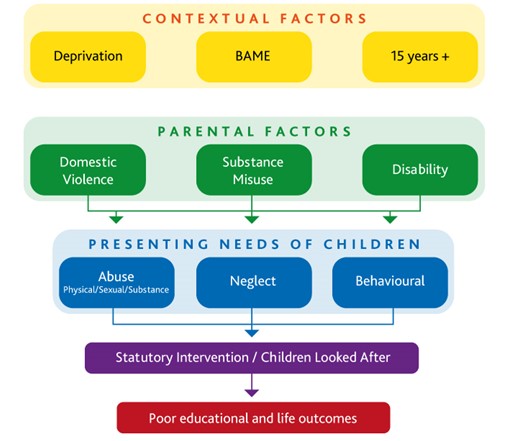
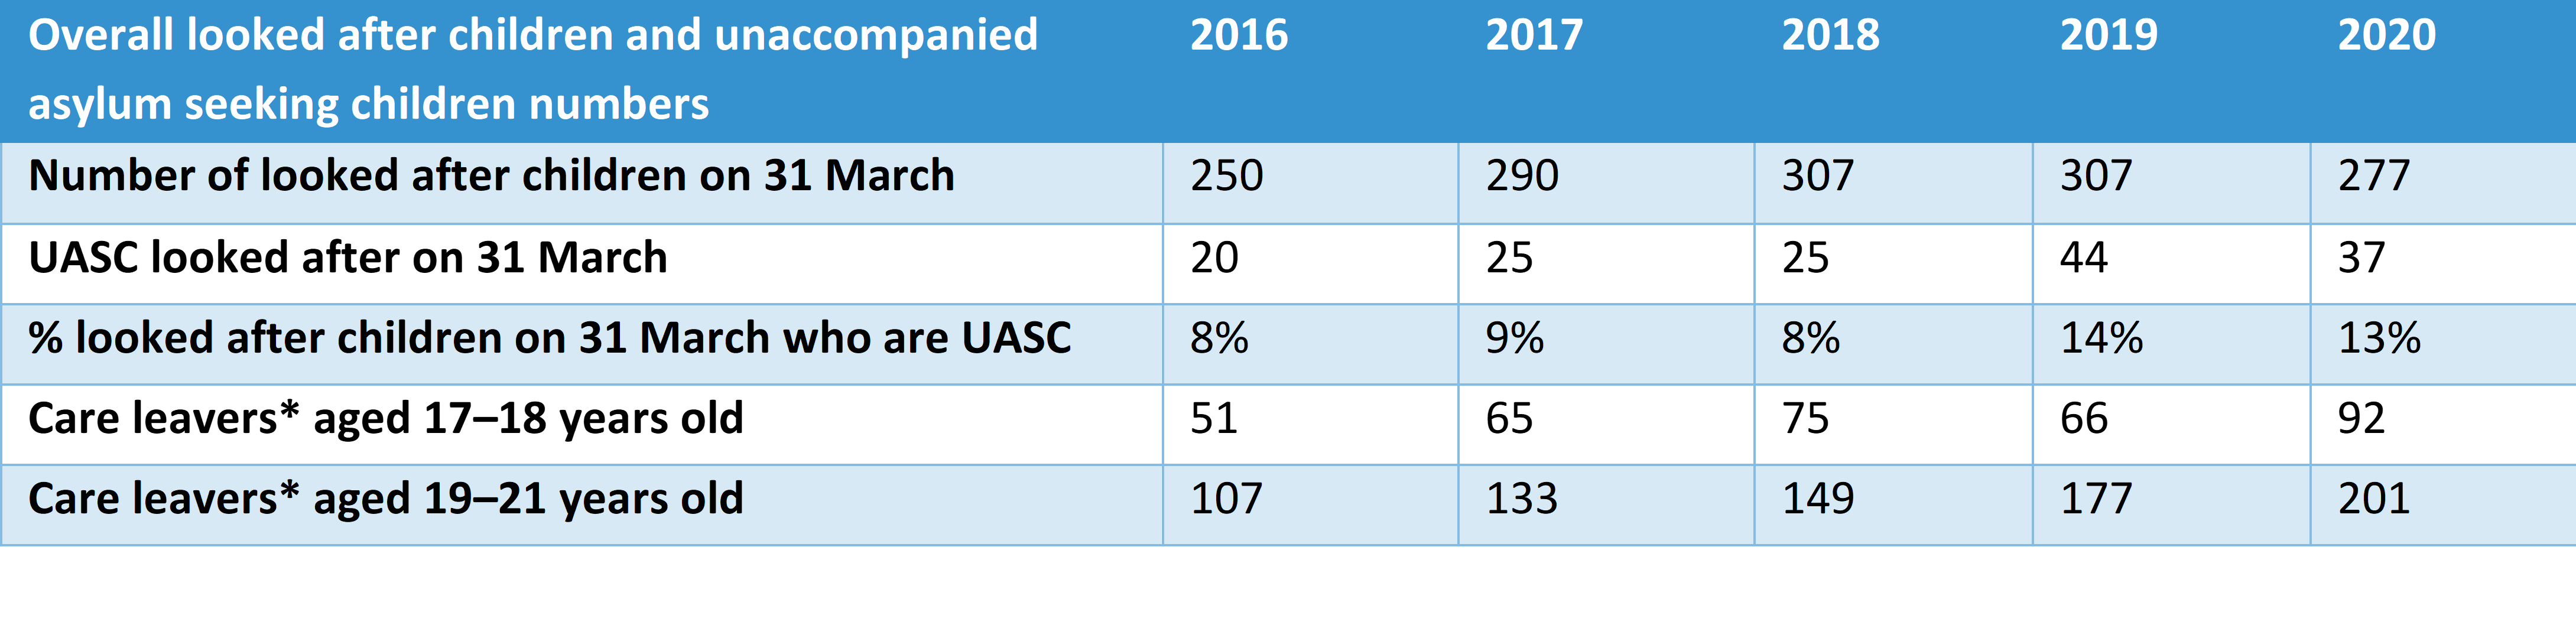
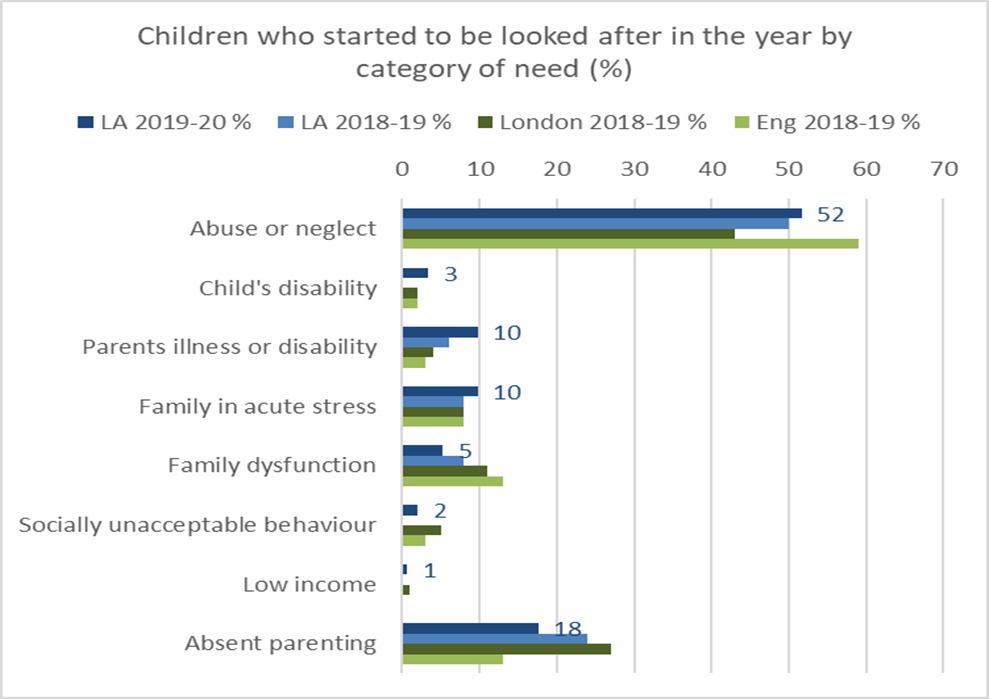
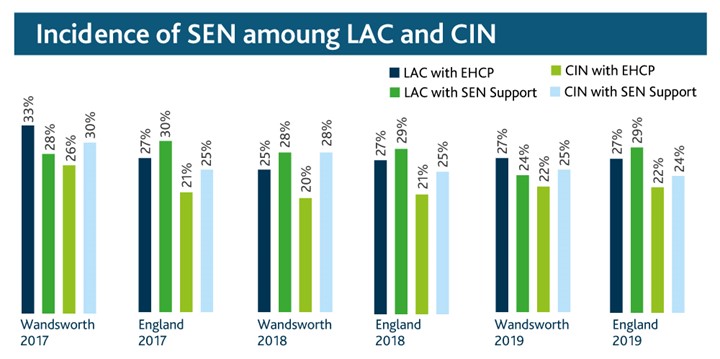
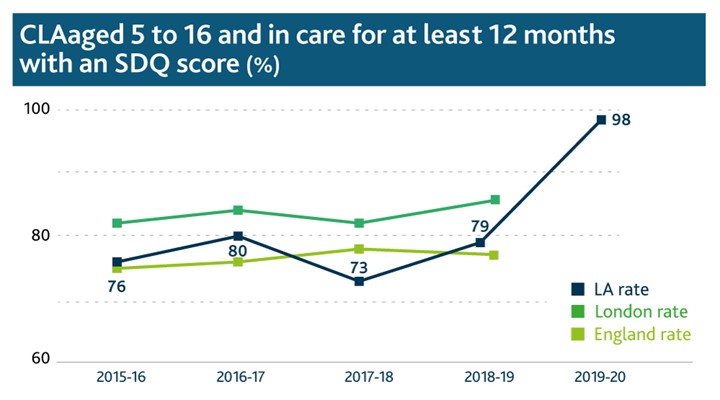
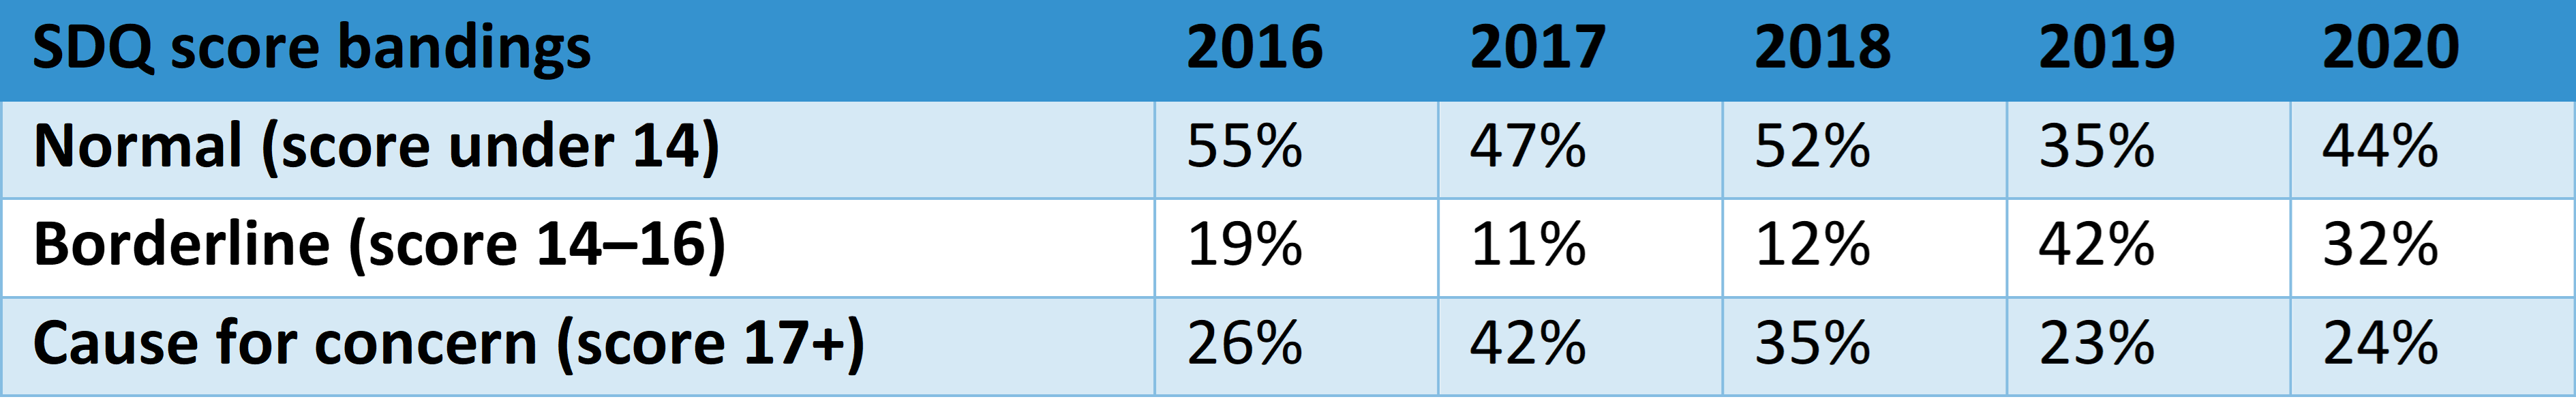
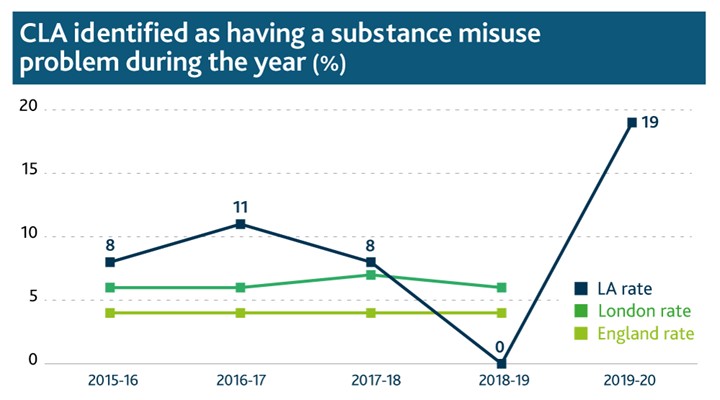
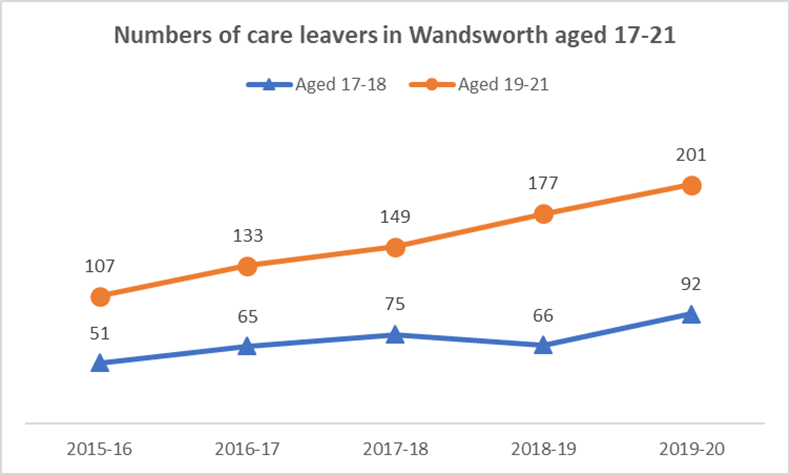
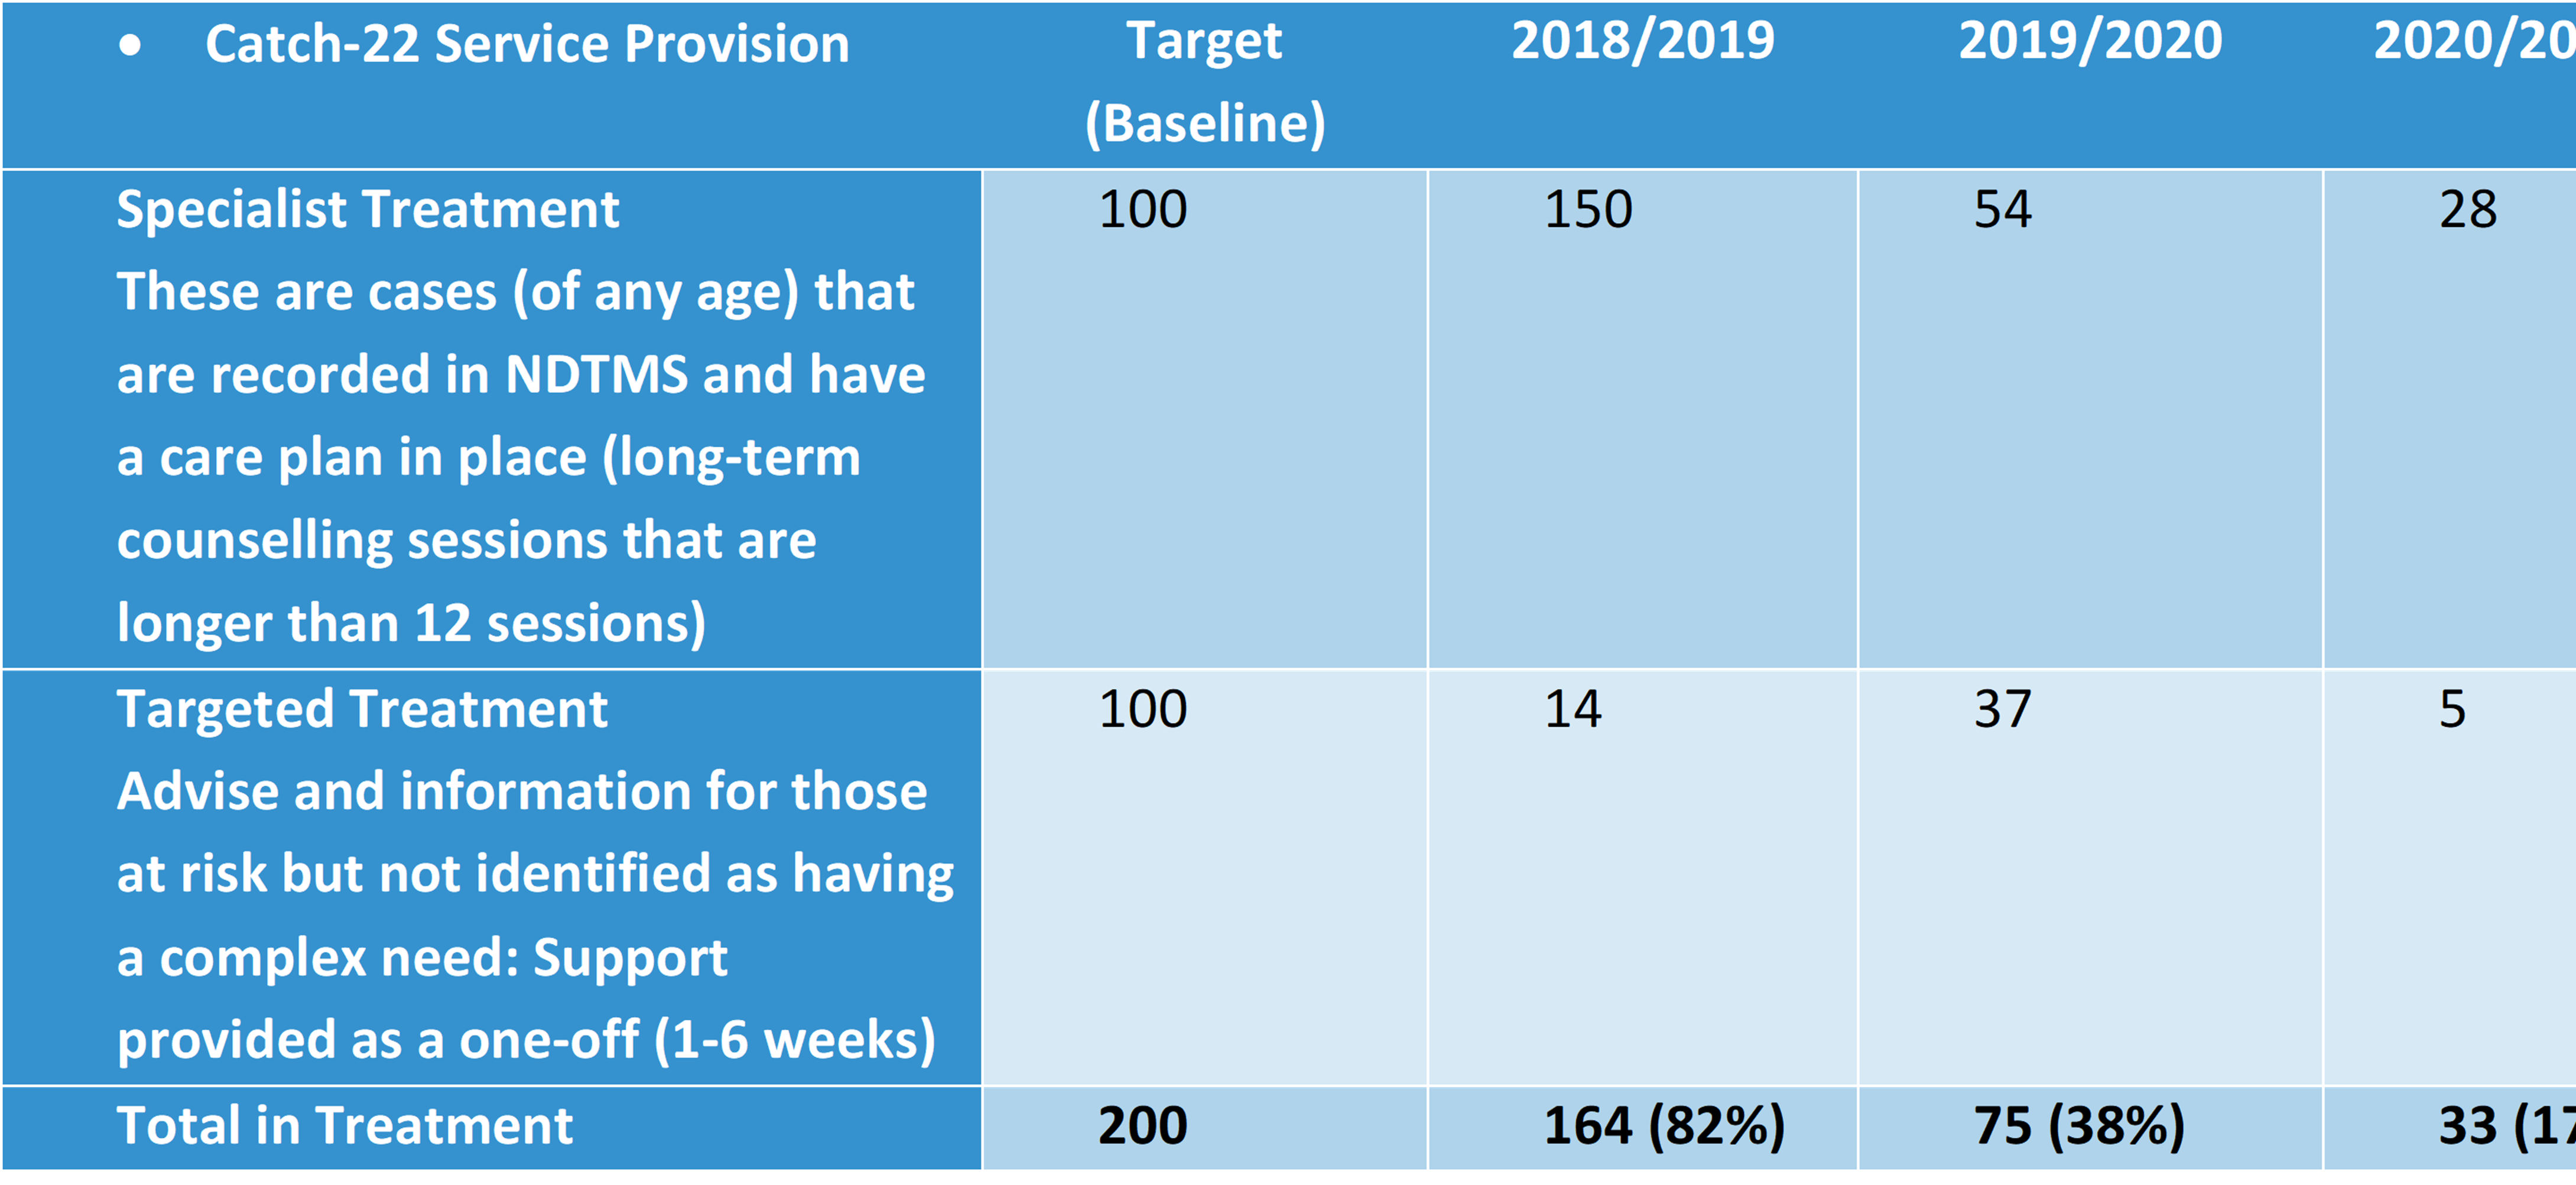
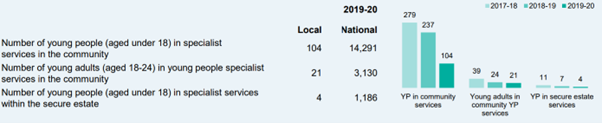
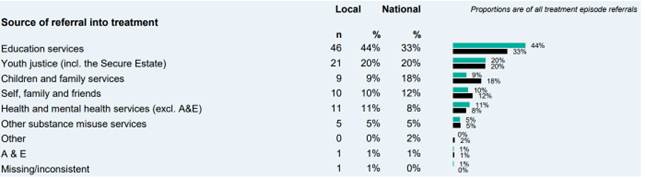
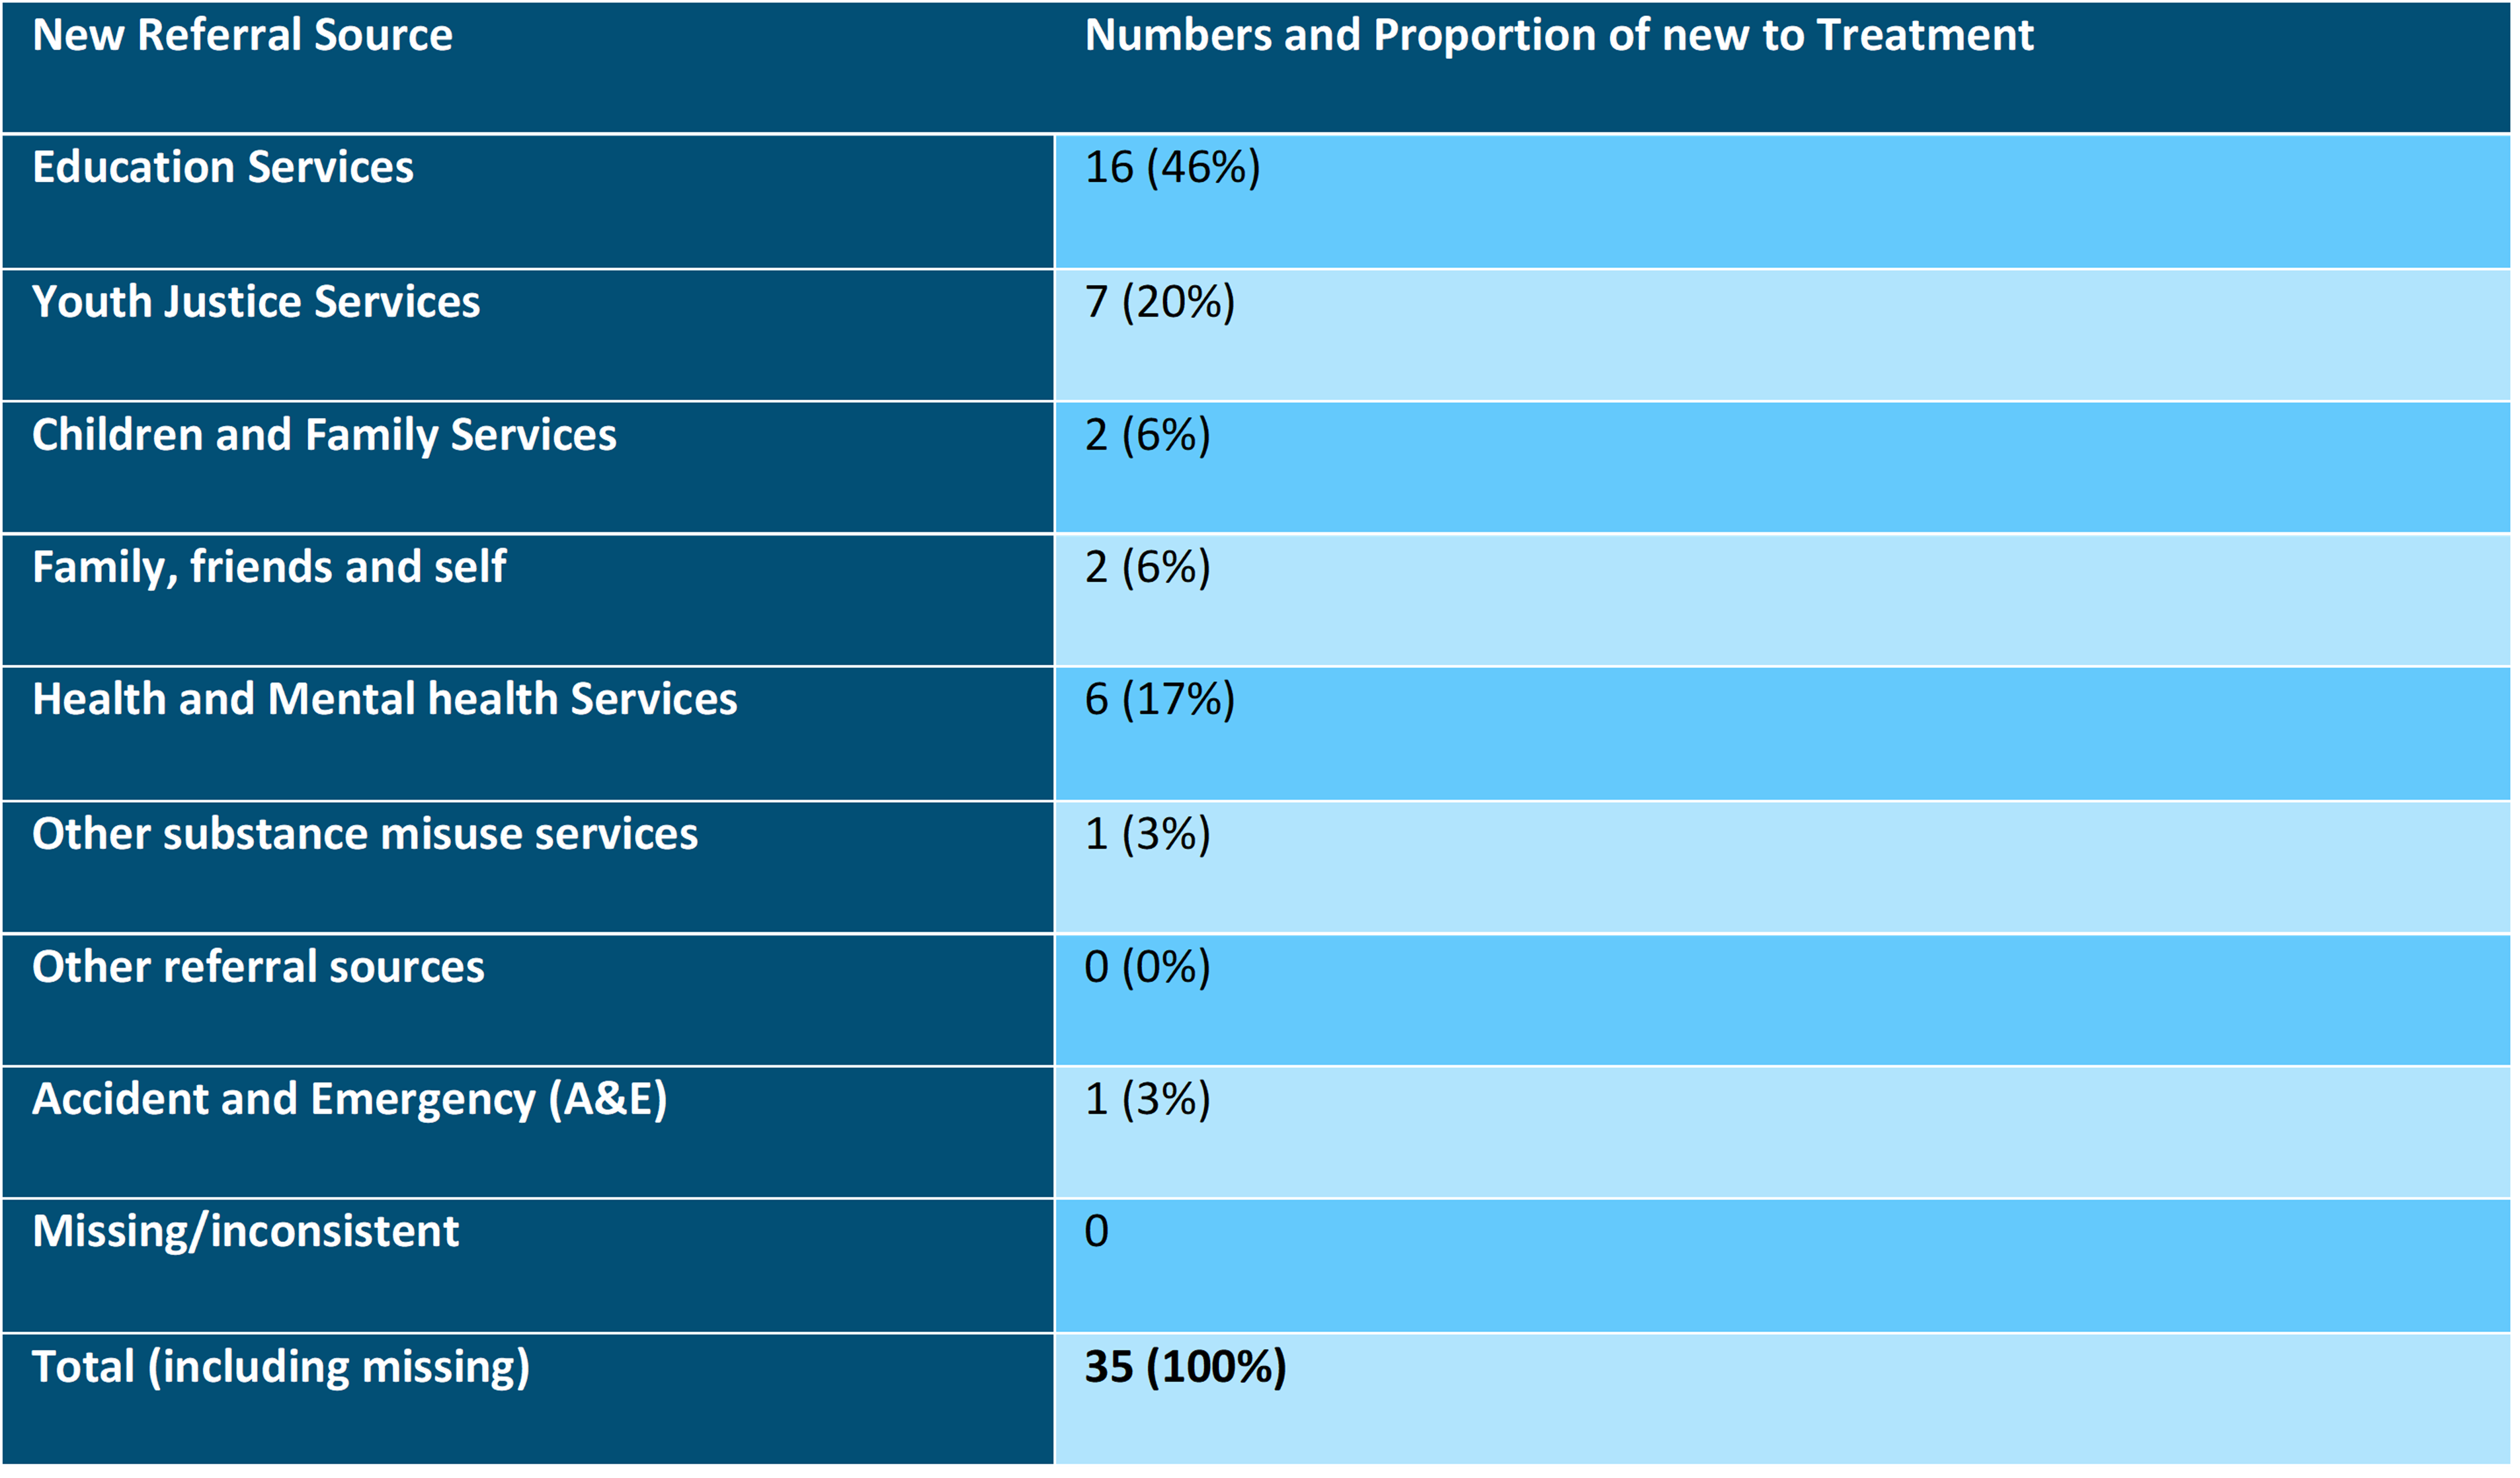
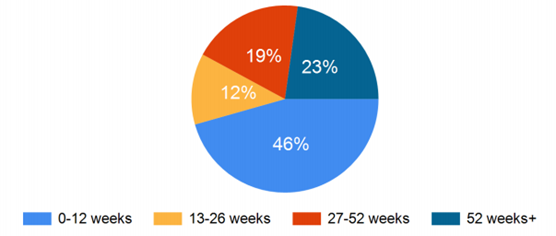
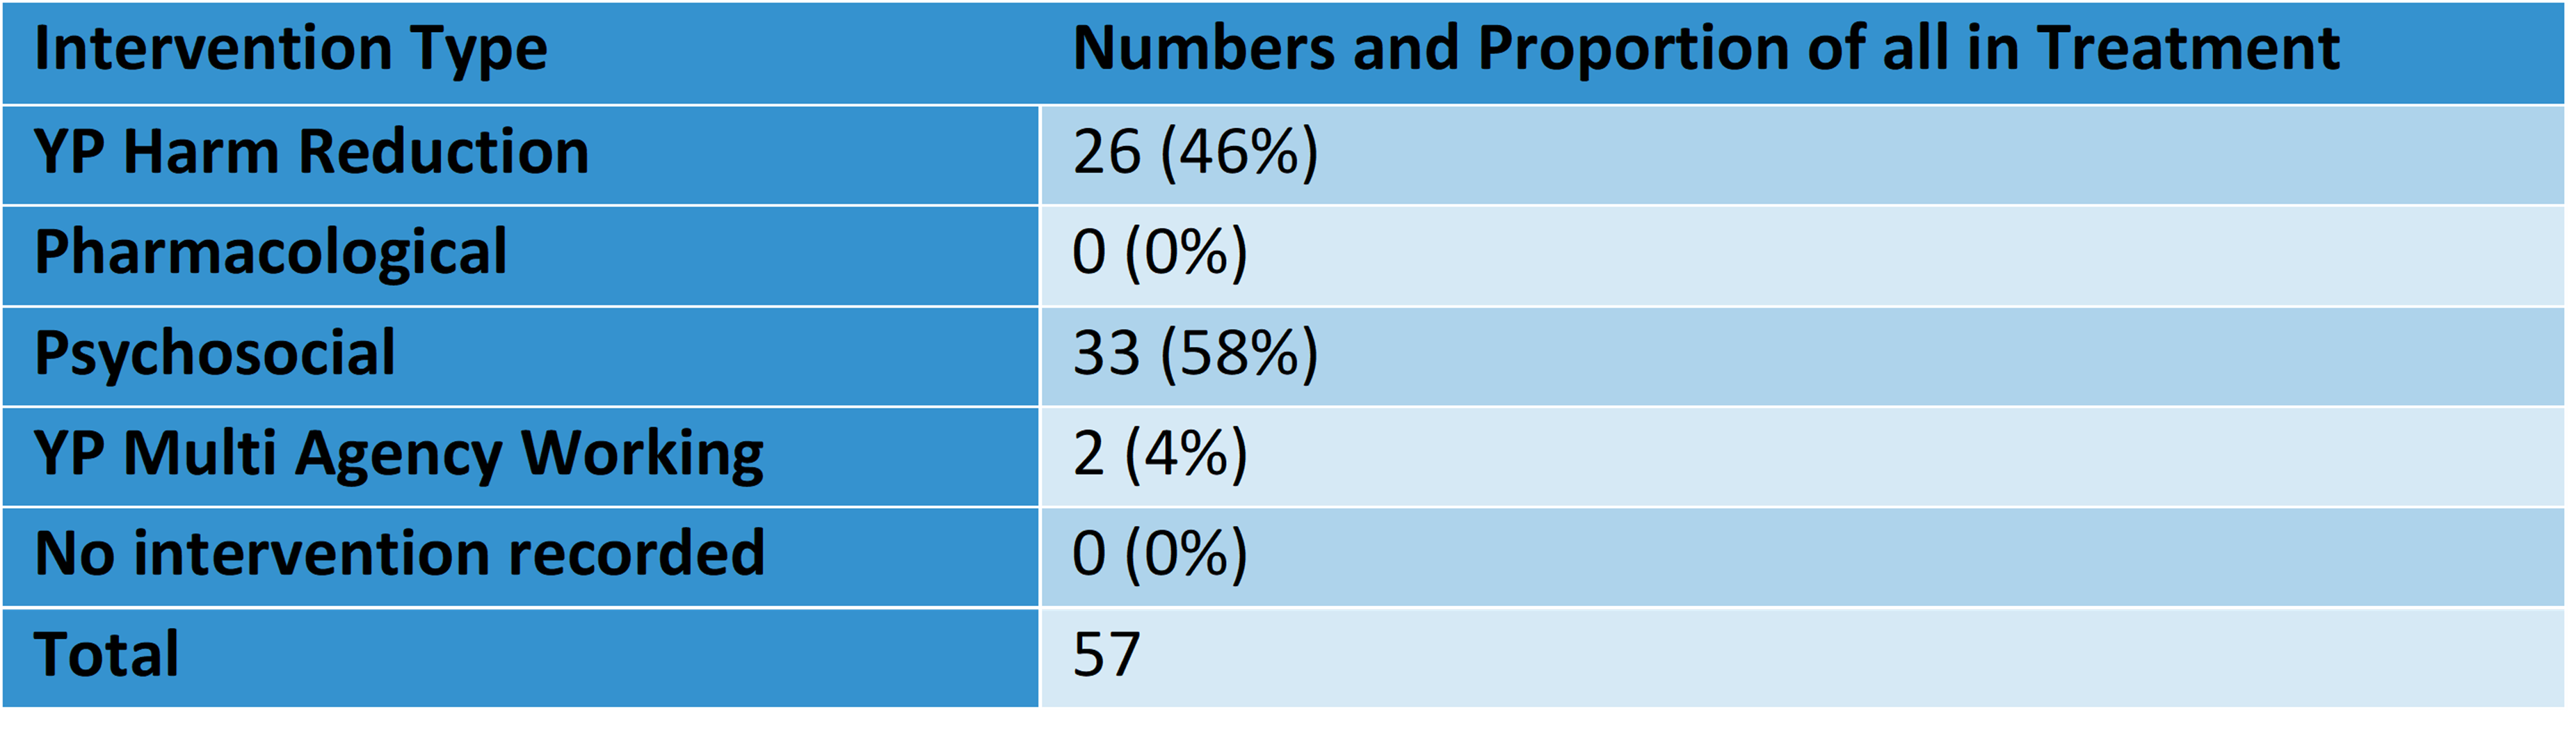
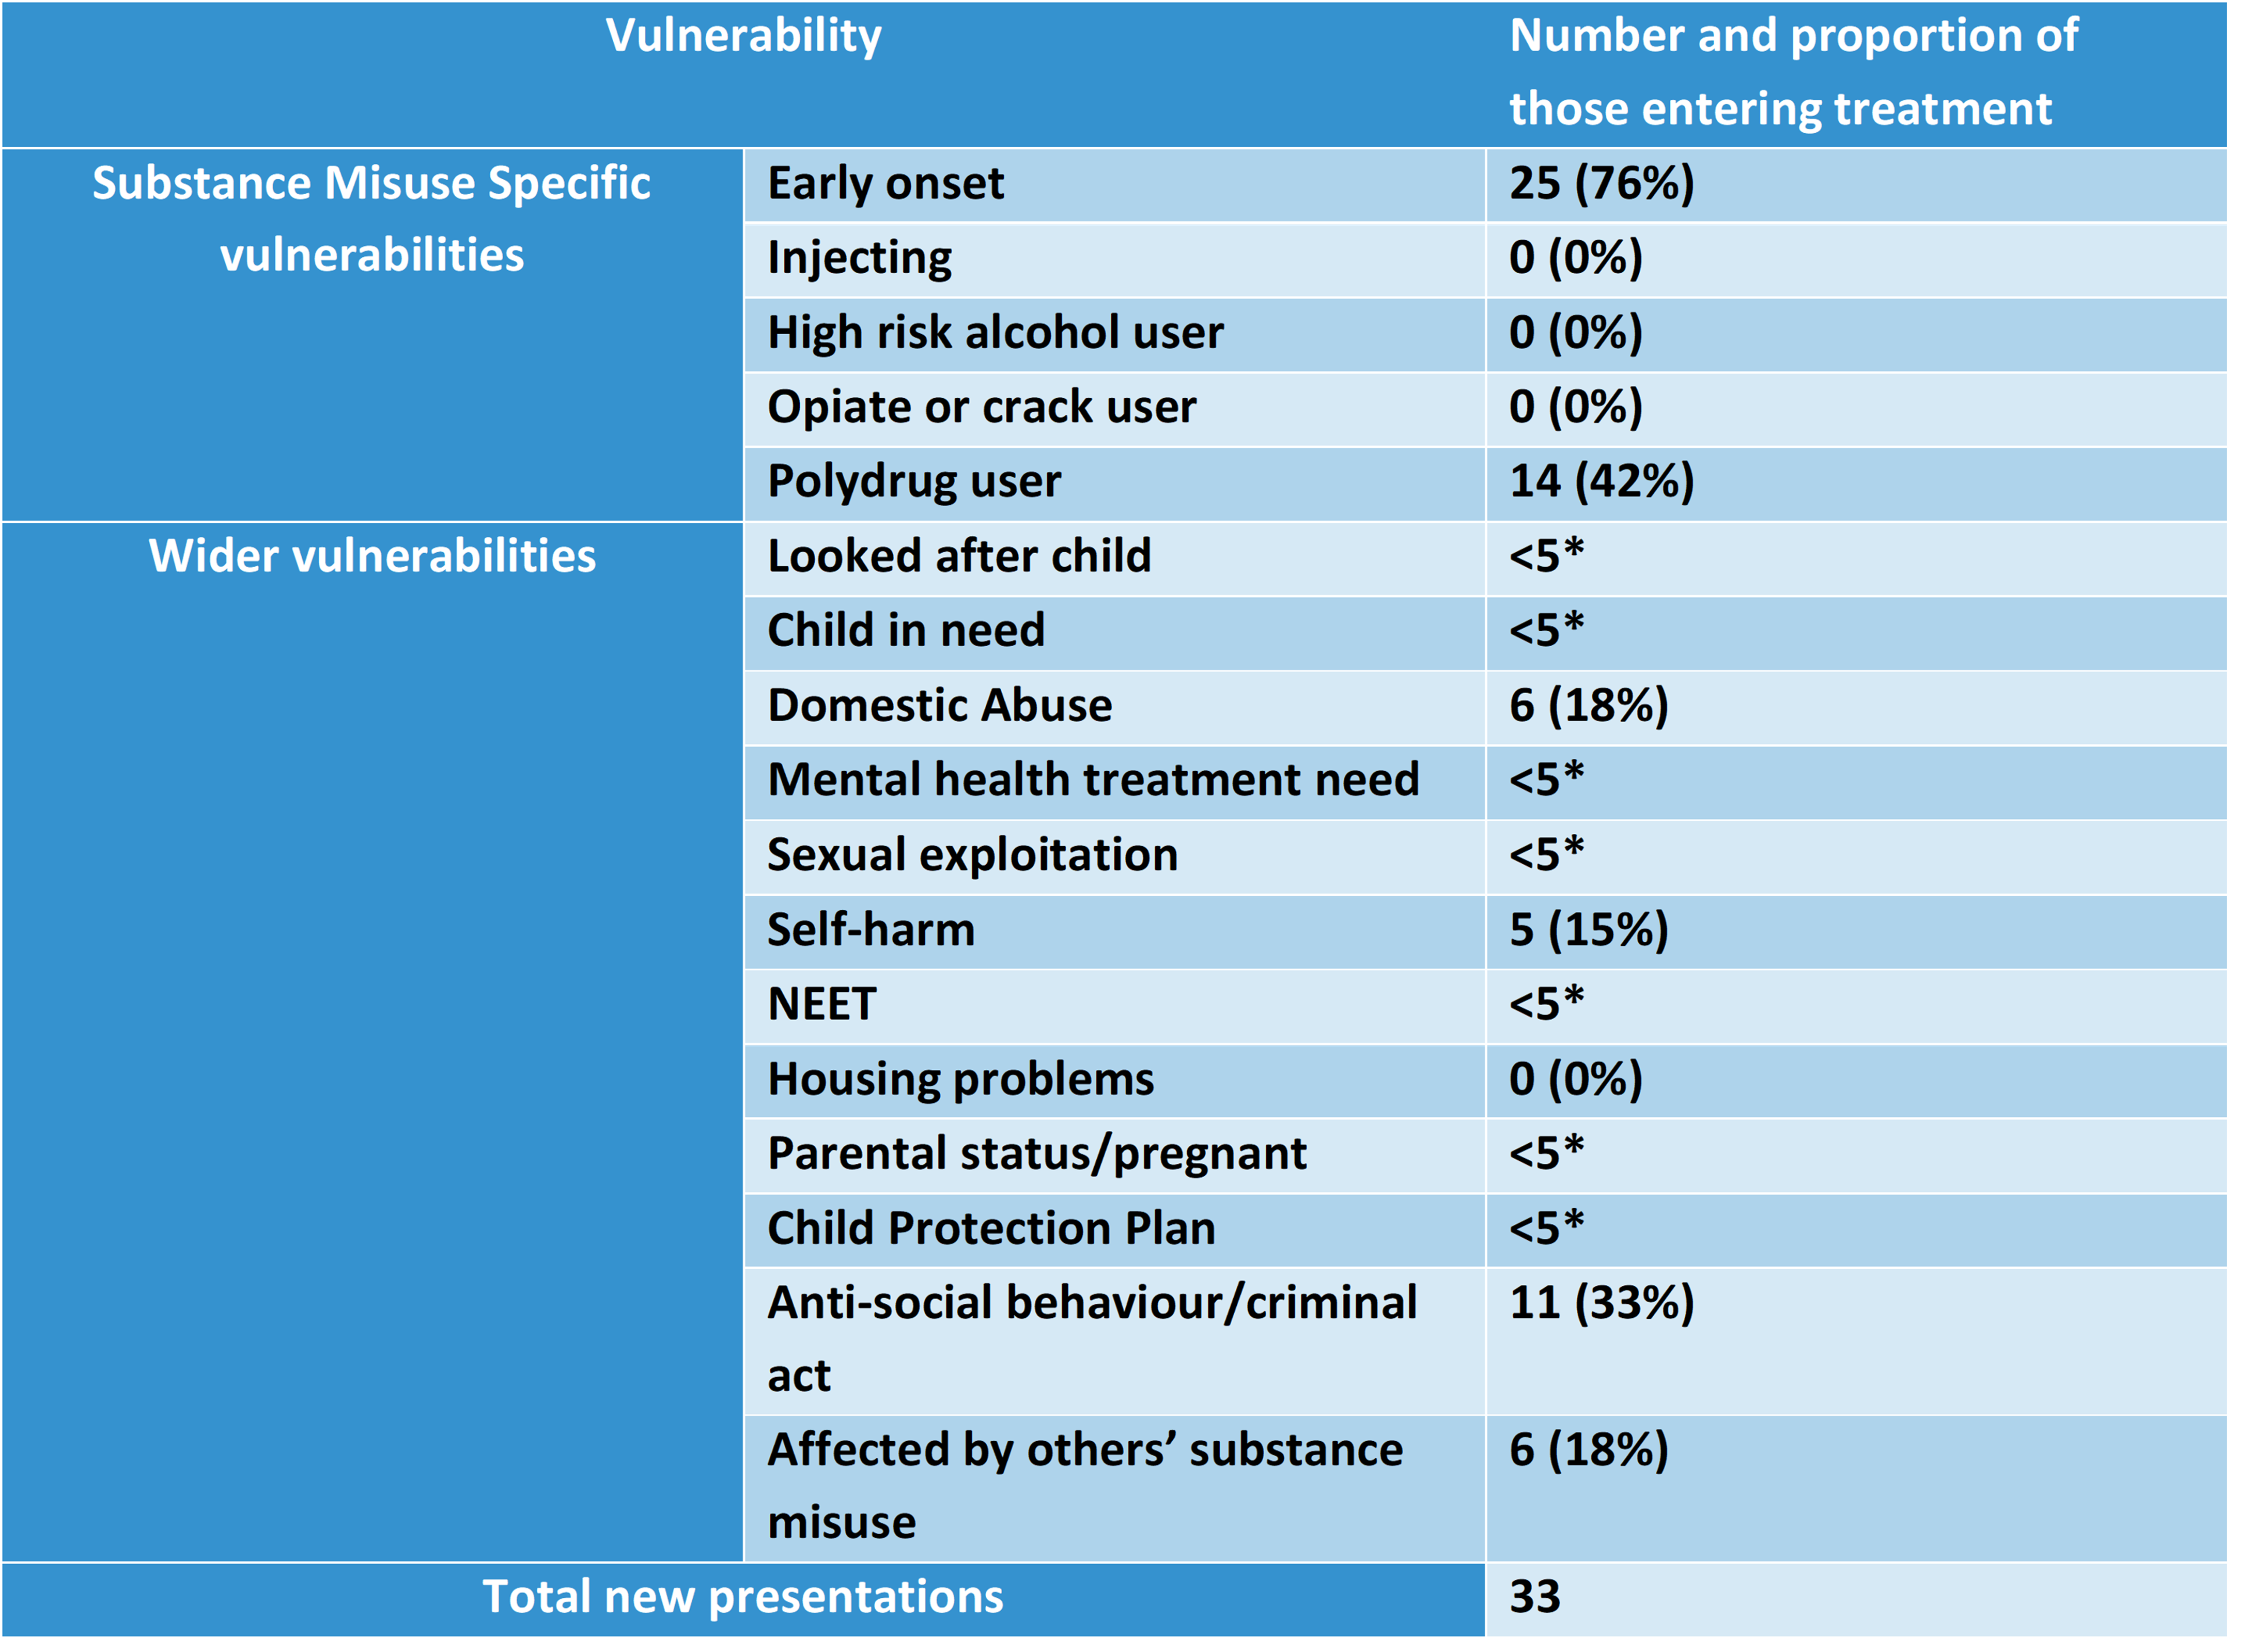
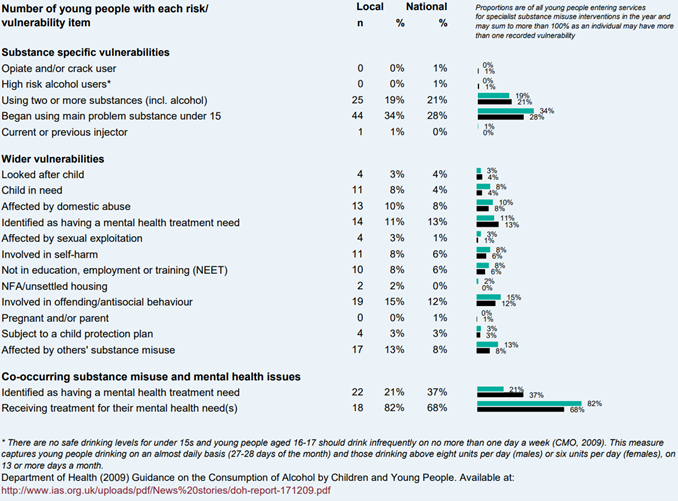
15. Education, Employment and Attainment

In 2018, 50,000 of the adult population in Wandsworth had completed full time education by the time they were 17–19 year old, a 22% increase from the previous year’s figure of 41,000.

The high performance of Wandsworth schools at Key Stage 4 (KS4) and earlier is not replicated at Key Stage 5 (KS5). Average scores at Key Stage 5 for both A Levels and applied general (a form of vocational qualification) are in line with the national average and below the London average (table below).

After KS4, the percentage of pupils that stay on in a school 6th form is very high at 72.4%. This compares to a national average of 37.6% and is the 2nd highest nationally. However, the percentage that go to college or into an apprenticeship is amongst the lowest in the country.

The percentage in employment or training after KS5 is in line with London, but slightly below the England average. However, the percentage going to university after KS5 is relatively high (10% above the national average) which may in part reflect the high proportion of KS5 pupils in school 6th forms.

Source: LG Inform/DfE, 2015/16 - 2020/21

*A level facilitating subjects are biology, chemistry, physics, Maths, further Maths, geography, history, English literature, modern and Classical languages.

Wandsworth has seen an increase in the numbers of young people who are classified as Not in Education, Employment of Training or Unknown (NEET). The data shows the number and proportion of 16 and 17 year olds recorded as in education or training in each local authority area is an estimate of the proportion and number of 16 and 17 year olds who are recorded as NEET, or whose activity is ‘not known’.

16 to 17 year olds not in education, employment or training (NEET) or whose activity is not known: In 2022/23, Wandsworth’s rate was 3.5% (n=152), which was the 13th highest in London, 32.0% lower than the England average and 4.1% higher than the London average. The latest Borough figure for 2022/23 was also 31.2% lower than in 2016/17, in comparison with 13.6% decrease in England’s rate in the equivalent time period.

Source: OHID: Public Health Profiles

Source: OHID: Public Health Profiles

The numbers of young people not in education, employment or training in Wandsworth is higher than expected and is out of line with the pattern of educational attainment. This is largely due to the high level of not knowns which stood at 8.8% of 16-17 year olds in 2020 in comparison to just 2.3% in London, and 2.8% in England. Operational processes have been put in place across the Council to reduce the level of not known which will support reducing the overall NEET level (including not known).

50% of Wandsworth care leavers aged 19–21 years were in education, employment or training in 2018/19, slightly lower than the averages for England (52%) and London (54%).

16. Risky Behaviours

Adolescence is a critical time in development. It is a period when life-long behaviours are set, long-term conditions emerge, and risk-taking behaviours begin (including sexual activity and experimentation with alcohol and drugs).

Nationally, recent trends have seen improvements in some areas of adolescent health including a reduction in young people’s health risk-taking behaviour 124. Young people’s rates of smoking, alcohol consumptions and teenage pregnancy rates have been on the decline over the past decade.

National evidence demonstrates that young people’s substance misuse is a causal factor of and contributor to a wide range of other serious problems. Substance misuse can exacerbate and be a consequence of falling behind in school, involvement in crime, anti-social behaviour and becoming a victim of crime. Alcohol and substance misuse can contribute to unplanned teenage pregnancy and sexually transmitted infections. Substance misuse is also a response to or a causal factor of mental health problems. This may be a contributing factor to episodes of missing from home and is strongly linked to the exploitation of young people such as through county lines and/or child sexual exploitation (CSE) 125. Furthermore, it can exacerbate problems relating to employment, housing and family life.

Nationally, recent trends have seen improvements in some areas of adolescent health including young people’s health risk-taking behaviour 126. Young people’s rates of smoking, alcohol consumption, and teenage pregnancy rates have been on the decline over the past decade.

16.1 Smoking

Smoking prevalence at age 15 - regular smokers (WAY survey): In 2014/15, Wandsworth’s rate was 5.0%, which was the 5th highest in London, 8.8% lower than the England average and 44.9% higher than the London average. Time series data were not available for this indicator.

Source: OHID: Public Health Profiles

Smoking behaviour in adults aged 15 years+ has also seen a recent downward trend and now stands at 11.8% of the population, below both London and England levels. The 2014/15 WAY survey amongst 15 year olds found that Wandsworth ranked the highest of all London boroughs in all three areas of the survey domains: current smokers (14.3%), regular (6.7%) and occasional Smokers (7.6%). In comparison to London, young people in Wandsworth who report regular smoking at age 15 years was 6.7% compared with 3.4% for London. Survey data for 15 year olds in Wandsworth are more than twice as likely to smoke than their peers across London (WAY survey 2014/15).

16.2 Substance Misuse

Percentage who have ever tried cannabis at age 15: In 2014/15, Wandsworth’s rate was 15.1%, which was the 5th highest in London, 41.1% higher than the England average and 38.5% higher than the London average. Time series data were not available for this indicator.

Source: OHID: Public Health Profiles

For 2018/19 there were 144 new referrals into the Young Persons Substance Misuse Service, a reduction from 226 in 2017/18. The top three referral routes were through children’s services, A&E and education providers. Primary substance misuse reported during 2018/19 was linked to cannabis 33%, followed by alcohol 12%, and others such as Benzodiazepines and MDMA were less than 2%. The ages of those referred to the service were mainly 15 to 16 years old (40%), followed by those who were 17 to 18 years old (27%) and 13 to 14 years old (21%). 40% were female and 60% male, while regards to ethnicity 37% were White, 6% Mixed, 3% Black, and 1% for Asian and other (51% did not state their ethnicity).

Hospital Admissions for Substance Misuse

Hospital admissions due to substance misuse (15 to 24 years): In 2020/21 - 22/23, Wandsworth’s rate was 37.4 per 100,000 (n=40), which was the 10th lowest in London, 35.9% lower than the England average and 25.2% lower than the London average. The latest Borough figure for 2020/21 - 22/23 was also 20.4% lower than in 2008/09 - 10/11, in comparison with 8.2% decrease in England’s rate in the equivalent time period.

Source: OHID: Public Health Profiles

Source: OHID: Public Health Profiles

Wandsworth Children and Young People Substance Misuse Treatment Data for JSNA

Local Prevalence Data

Admission episodes for alcohol specific conditions in Wandsworth for under 18 year olds between 2017/18 and 2019/20 is 13.1 per 100,000 and has been on a downward trend since 2008/09; equivalent to 25 admissions, 10 of which were males and 15 to females. This rate is lower than London (15.4) and England (30.7) 132.

Data from the Public Health Outcomes Framework (PHOF) and Child and Maternal Health on certain groups of young people at risk of substance misuse provides a good overview of the impact of alcohol and drugs.

These include the following groups:

  1. During 2019 the first time 10-17 year olds entering the youth justice system, receiving their first conviction, caution or youth caution, was 268.3 per 100,00. This was slightly higher than London (260.2 per 100,00) and England (208.0 per 100,00) but has generally been on a downward trend since 2010. Children and young people at risk of offending or within the youth justice system often have more unmet health needs, including mental health, than other children. This indicator is included to ensure that vulnerable children and young people aged 10-17 years at risk of offending, are included in mainstream planning and commissioning.

  2. In 2019, 420 of 16–17 year olds in Wandsworth were not in education, employment or training (NEET) or whose activity was not known. This is equivalent to 10.2% and is the second highest rate in London. This trend has been increasing since 2016 and is higher than London (4.2%) and England (5.5%). Young people who are NEET are at greater risk of a range of negative outcomes, including poor health, depression or early parenthood.

  3. During 2019/20, 10,045 of all dependent children under 20 years of age are in low-income families. This is equivalent to 18.1% which is lower than London (19.3%) but higher than England (17.0%). There is also a wide variety of evidence to show that children who live in poverty are exposed to a range of risks that can have a serious impact on their mental health, drug and alcohol use.

  4. During 2017/18, 180 children were leaving care. This is equivalent to 28.6 per 10,000 children under 18 years of age and higher than London (27.3 per 10,000) and England (25.2 per 10,000). Young people in care are over-represented in mental health statistics, which is closely linked to drugs and alcohol. Being in care when young is also a determinant of adult mental health, and is associated with increased levels of antisocial behaviour, emotional instability and psychosis.

  5. In 2020, there were 275 children in care, which is equivalent to 43 per 10,000 children aged under 18 years. This is less than London (49), and England (67). Children and young people in care are among the most socially excluded in England. There are significant inequalities in health and social outcomes compared with all children, and these contribute to poor health and social exclusion of care leavers later in life.

The table below lists assessment factors identified in children between 0–17 year olds who were referred to Wandsworth’s Children’s Social Care due to drug and alcohol use.

Factors contributing to young people misusing substances in Wandsworth

Source: NDTMS

Clearly there is a significant need for mental health, drug and alcohol support for young people, their parents and carers and those in close contact. Young people’s substance misuse services need to be integrated with the adult’s treatment services and other relevant mental health services to ensure these interlinked needs are addressed appropriately and effectively.

Local Treatment Data

This section highlights key performance information about young people under the age of 18 years accessing specialist substance misuse interventions provided by Catch-22 and other specialist treatment services. The data is taken from the National Drug Treatment Monitoring System (NDTMS) managed by Public Health England (PHE) which reflects specialist treatment activity reported for young people with problems around alcohol and drug misuse.

Table below shows the headline totals for the number of young people in treatment in Wandsworth from Catch-22 and other specialist treatment services each year from 2016/17 Q4 until 2020/21 Q4. The data highlights a marked decrease in young people accessing specialist substance misuse interventions over the last five years. The numbers in treatment had significantly gone down in 2020/21 due to limited interaction with young people during the COVID-19 pandemic. Numbers in treatment going down in 2019/20 and before can be attributed to a number of factors such as capturing data and categorisation, reduced number of referrals, and young people having difficulty seeking help in school settings.

Total numbers of Young People in specialist treatment services over the years in Wandsworth

*-providers in Wandsworth include Catch-22, Edge of Care, Youth Offending Team, Wandsworth Child and Adolescent Mental Health Services (CAMHS) and Wandsworth young person treated in other boroughs Source: NDTMS

Table below provides a summary of numbers in treatment in the Catch-22 service. Trends show the service has not been meeting its targets for the last three years in terms of numbers in treatment. Reasons for this decline in target achievement could be attributed to factors mentioned earlier.

Numbers in treatment for Catch-22 service in Wandsworth 2020/21

Source: NDTMS

Figure below further reflects the number of young people and young adults in specialist substance misuse services in Wandsworth during 2017-18, 2018-19 and 2019-20. It includes the number of young people and young adults in specialist substance misuse services in the community, and the number of young people who have received specialist treatment within a secure setting. Secure estate includes provision in young offender institutions, secure training centres, secure children’s homes and welfare only homes.

Number of young people in specialist substance misuse services in Wandsworth during 2017-18, 2018-19 and 2019-20

Source: NDTMS

The figures below highlight the sources of referrals of young people to specialist substance misuse services in Wandsworth in 2019/20. These trends are similar to national levels, except for greater referrals from health and mental health services and less referrals from children and family services. Overall, in both years, highest referrals were obtained from Education and Youth Justice services, followed by mental health, self, family and friends.

Sources of new referrals to specialist substance misuse services in Wandsworth during 2019/20

Source: NDTMS

Sources of new referrals to specialist substance misuse services in Wandsworth during 2020/21

Source: NDTMS

Figure below highlights the young people’s length of time utilising specialist treatment services in Wandsworth in 2020/21. The highest proportion was those with less than 12 weeks of treatment, followed by those with 52+ weeks of treatment. The average treatment length was 32.49 weeks.

Length of time in Specialist treatment Services in Wandsworth 2020/21

Source: NDTMS

Table below highlights the types of interventions delivered by treatment services to young people (YP). An individual may receive more than one intervention during their time in treatment so percentages may add up to more than 100%. Psychosocial interventions are the most commonly used in treatment. YP Harm Reduction and YP Multi Agency interventions are the second and third most commonly used interventions, respectively. No pharmacological interventions were recorded because these cases are managed by adult’s treatment services, and beyond the scope of the Young People Substance Misuse Service due to vacancies in nurse positions.

Interventions delivered to young people in treatment in 2020/21 across Wandsworth

Source: NDTMS

Around 70% (26 individuals out of 57 in treatment) had planned exits during 2020/21 meaning 30% of young people did not complete treatment. None of the young service users leaving as planned have re-presented to the service within 6 months.

The most used substance by 57 individuals in specialist treatment include cannabis (75% - 43 individuals) followed by alcohol (60% - 34 individuals). This was followed by 16% using solvents (9 individuals) and 14% using other drugs (8 individuals. Less than five individuals were using ecstasy, cocaine and nicotine. Numbers smaller than five are suppressed to protect confidentiality of service users. The majority of the 57 service users during 2020/21 were male (60%). Those aged 16 and 17 years made up the highest proportion of clients (32% and 30% respectively). This was followed by 13–14-year olds (21%) and 15 year olds (18%).

Table below outlines the vulnerabilities of young people entering specialist substance misuse treatment services in Wandsworth during 2020/21. The proportions may sum to more than 100% due to some individuals having more than one recorded vulnerability. Across both years, the highest vulnerabilities related specifically to substance misuse were early onset (consuming before age of 15) and using two or more substance. Common wider vulnerabilities were anti-social behaviour/criminal behaviour, being affected by other’s substance misuse, domestic violence and self-harm. Figure below shows how co-occurring mental health and substance misuse is a predominant vulnerability in the borough, with the majority receiving treatment for mental health and substance misuse together. This may be due to the nature of the treatment being a counselling service, not pharmacological.

Vulnerabilities of 33 young people entering specialist substance misuse treatment in Wandsworth during 2020/21
  • Numbers smaller than 5 are suppressed to protect confidentiality of service users Source: NDTMS
Vulnerabilities of 58 young people entering specialist substance misuse treatment in Wandsworth during 2019/20

16.3 Alcohol Misuse

Percentage who have been drunk in the last 4 weeks at age 15: In 2014/15, Wandsworth’s rate was 9.2%, which was the 13th highest in London, 37.0% lower than the England average and 3.4% higher than the London average. Time series data were not available for this indicator.

Source: OHID: Public Health Profiles

Alcohol Attributable Admissions

Admission episodes for alcohol-specific conditions - Under 18s: In 2020/21 - 22/23, Wandsworth’s rate was 11.2 per 100,000 (n=20), which was the 9th lowest in London, 56.9% lower than the England average and 24.6% lower than the London average. The latest Borough figure for 2020/21 - 22/23 was also 67.5% lower than in 2012/13 - 14/15, in comparison with 33.5% decrease in England’s rate in the equivalent time period.

Source: OHID: Public Health Profiles

Source: OHID: Public Health Profiles

16.4 Three or More Risky Behaviours in Children aged 15 years

Percentage with 3 or more risky behaviours at age 15: In 2014/15, Wandsworth’s rate was 12.2%, which was the 9th highest in London, 23.3% lower than the England average and 20.8% higher than the London average. Time series data were not available for this indicator.

Source: OHID: Public Health Profiles

Acronyms


  1. Department of Health (DH), Department for Children Schools and Families (DCSF). Healthy Child Programme. 2009↩︎

  2. DataWand. 2021. URL: https://www.datawand.info/population/#/view-report/63aeddf1d7fc44b8b4dffcd868e84eac/___iaFirstFeature/G3↩︎

  3. © GLA 2021-based demographic projections. Housing-led population projections. Past Delivery 10-year migration, 2023. URL: https://data.london.gov.uk/dataset/housing-led-population-projections↩︎

  4. Indicator is defined as percentage of children aged under 16 living in families in receipt of Child Tax Credit whose reported income is less than 60 per cent of the median income or in receipt of Income Support or (Income-Based) Job Seeker’s Allowance.↩︎

  5. GOV.UK. Schools, pupils, and their characteristics: January 2020.Data used: table 4c. URL: https://www.gov.uk/government/statistics/schools-pupils-and-their-characteristics-january-2019↩︎

  6. Public Health England. Making the Case for Preconception Care Planning and preparation for pregnancy to improve maternal and child health outcomes. 2019. URL: https://www.gov.uk/government/publications/preconception-care-making-the-case↩︎

  7. Inskip HM, Crozier SR, Godfrey KM, Borland SE, Cooper C, Robinson SM. Women’s compliance with nutrition and lifestyle recommendations before pregnancy: general population cohort study. BMJ. 2009 Feb 12;338:b481.↩︎

  8. World Health Organization. Policy Brief: Preconception Care – Maximising the gains for maternal and child health. 2013. URL: https://www.who.int/publications/i/item/9789241505000↩︎

  9. Office for National Statistics. Child mortality in England and Wales: 2016. URL: https://www.ons.gov.uk/peoplepopulationandcommunity/birthsdeathsandmarriages/deaths/bulletins/childhoodinfantandperinatalmortalityinenglandandwales/2021↩︎

  10. OHID Public Health Profiles. Under 18s conception rate. URL: https://fingertips.phe.org.uk/search/conception%20rate#page/4/gid/1/pat/6/par/E12000007/ati/402/are/E09000032/iid/20401/age/173/sex/2/cat/-1/ctp/-1/yrr/1/cid/4/tbm/1/page-options/car-do-0↩︎

  11. Office for National Statistics. Conception and Fertility Rates. 2021. URL: https://www.ons.gov.uk/peoplepopulationandcommunity/birthsdeathsandmarriages/conceptionandfertilityrates/bulletins/conceptionstatistics/2021#age-at-conception↩︎

  12. Measured as percentage of mothers who give their babies breast milk in the first 48 hours after delivery↩︎

  13. The Lancet. Lancet breastfeeding series paper 1. data sources and estimates: countries without standardized surveys. 2016. URL: https://www.thelancet.com/cms/attachment/2047468706/2057986218/mmc1.pdf↩︎

  14. United Nations Children’s Fund, Division of Data Research and Policy. UNICEF Global Databases: Infant and Young Child Feeding. 2018↩︎

  15. McAndrew F, Thompson J, Fellows L, et al. Infant Feeding Survey 2010. NHS Health and Social Care Information Centre. 2012.↩︎

  16. Public Health England (2017) giving every child the best start in life: LGA Early Years Conference↩︎

  17. UNICEF. Baby Friendly Initiative. 2021. URL: https://www.unicef.org.uk/babyfriendly/about/breastfeeding-in-the-uk/↩︎

  18. Public Health England (2019). Breastfeeding at 6–8 weeks quarterly data. 2019. URL: https://www.gov.uk/government/statistics/breastfeeding-at-6-to-8-weeks-after-birth-2018-to-2019-quarterly-data↩︎

  19. Central London Community Healthcare (CLCH) breastfeeding data 2018/19 Q1–4↩︎

  20. NHS. 12-week Maternal Assessment & Breastfeeding Initiation & UNIFY Collections: Guidance & Frequently Asked Questions. 2021. URL: https://www.england.nhs.uk/statistics/category/statistics/↩︎

  21. NHS. Hearing tests for children. 2021. URL: https://www.nhs.uk/conditions/hearing-tests-children/↩︎

  22. NHS. HPV vaccine overview. 2021. URL: https://www.nhs.uk/conditions/vaccinations/hpv-human-papillomavirus-vaccine/↩︎

  23. MenACWY vaccine NHS overview. URL: https://www.nhs.uk/conditions/vaccinations/men-acwy-vaccine/↩︎

  24. PHOF, Guide to Early Years Profile (2014); NHSOF; Early Intervention Foundation - The Best Start at Home (March 2015); NICE QS115 (2016); and Working Together to Safeguard Children (2015).↩︎

  25. Department of Health and Social Care. Healthy Child Programme: Pregnancy and the First 5 Years of Life. 2009. URL: https://www.gov.uk/government/publications/healthy-child-programme-pregnancy-and-the-first-5-years-of-life↩︎

  26. Cowley et al. Why Health Visiting? A review of the literature about key health visitor interventions, processes and outcomes for children and families. 2013. URL: https://www.researchgate.net/publication/236134248_Why_Health_Visiting_A_review_of_the_literature_about_key_health_visitor_interventions_processes_and_outcomes_for_children_and_families_Department_of_Health_Policy_Research_Programme_King's_College_Lon↩︎

  27. NICE: Early years: promoting health and wellbeing in under 5s. URL: https://www.nice.org.uk/guidance/qs128/chapter/quality-statement-2-speech-and-language↩︎

  28. National Literacy Trust. Language unlocks reading: supporting early language and reading for every child. 2018. URL: https://cdn.literacytrust.org.uk/media/documents/Language_unlocks_reading.pdf↩︎

  29. National Literacy Trust. Language unlocks reading: supporting early language and reading for every child. 2018. URL: https://cdn.literacytrust.org.uk/media/documents/Language_unlocks_reading.pdf↩︎

  30. Department of Health. Childhood obesity: a plan for action. 2018. URL: https://assets.publishing.service.gov.uk/government/uploads/system/uploads/attachment_data/file/718903/childhood-obesity-a-plan-for-action-chapter-2.pdf↩︎

  31. Public Health England. Health Matters: Obesity and the food environment. 2018. URL: https://www.gov.uk/government/publications/health-matters-obesity-and-the-food-environment/health-matters-obesity-and-the-food-environment--2↩︎

  32. WHO. Noncommunicable diseases: Childhood overweight and obesity. 2020. URL: https://www.who.int/news-room/questions-and-answers/item/noncommunicable-diseases-childhood-overweight-and-obesity↩︎

  33. Office for Standards in Education. Children’s Services and Skills – Obesity, healthy eating and physical activity in primary schools. 2018. URL: https://www.gov.uk/government/publications/obesity-healthy-eating-and-physical-activity-in-primary-schools↩︎

  34. Northstone K & Emmett PM. Are dietary patterns stable throughout early and mid-childhood? A birth cohort study. The British Journal of Nutrition, 100(5), 1069–1076. 2018↩︎

  35. NHS Digital. National Child Measurement Programme 2016/17. URL: https://digital.nhs.uk/data-and-information/publications/statistical/national-child-measurement-programme/2016-17-school-year↩︎

  36. NHS Digital. National Child Measurement Programme 2016/17. URL: https://digital.nhs.uk/data-and-information/publications/statistical/national-child-measurement-programme/2016-17-school-year↩︎

  37. PHE. Obesity map. 2021. URL: https://assets.publishing.service.gov.uk/government/uploads/system/uploads/attachment_data/file/296290/obesity-map-full-hi-res.pdf↩︎

  38. Public Health England (PHE). Health matters: whole systems approach to obesity. 2019. URL: https://www.gov.uk/government/publications/health-matters-whole-systems-approach-to-obesity/health-matters-whole-systems-approach-to-obesity↩︎

  39. The London Child Obesity Taskforce. Every Child A Healthy Weight. Ten Ambitions for London. 2019. URL: https://www.london.gov.uk/sites/default/files/every_child_a_healthy_weight.pdf↩︎

  40. Delgado-Noguera, M., Tort, S., Martínez-Zapata, M. J., & Bonfill, M. J. (2011). Primary school interventions to promote fruit and vegetable consumption: a systematic review and meta-analysis. Preventative Medicine, 53(1-2), 3-9; Bull, C. J., & Northstone, K. (2016). Childhood dietary patterns and cardiovascular risk factors in adolescence: results from the Avon Longitudinal Study of Parents and Children (ALSPAC) cohort. Public Health Nutrition19(18), 3369-3377; Holley, C. E., Farrow, C., & Haycraft, E. (2017). A Systematic Review of Methods for Increasing Vegetable Consumption in Early Childhood. Current Nutrition Reports, 6, 157-170↩︎

  41. World Health Organization. Healthy Diet. 2023. URL: https://www.who.int/news-room/fact-sheets/detail/healthy-diet↩︎

  42. PHE. The Eatwell Guide: Helping you eat a healthy, balanced diet. 2018. URL: https://www.gov.uk/government/publications/the-eatwell-guide↩︎

  43. NHS. Health Survey for England 2018 [NS]. 2018. URL: https://files.digital.nhs.uk/78/A85200/HSE18-Child-Health-rep.pdf↩︎

  44. Roberts, C., Steer, T., Maplethorpe, N., Cox, L., Meadows, S., Nicholson, S., Swan, G. National Diet and Nutrition Survey. 2018.↩︎

  45. Roberts, C., Steer, T., Maplethorpe, N., Cox, L., Meadows, S., Nicholson, S., Swan, G. National Diet and Nutrition Survey. 2018.↩︎

  46. British Nutrition Foundation. Minerals and trace elements. 2021. URL: https://www.nutrition.org.uk/healthy-sustainable-diets/vitamins-and-minerals/↩︎

  47. Victora CG, Bahl R, Barros AJD, Franca GVA, Horton S, Krasevec J, Murch S, Sankar MJ, Walker N, Rollins NC (2016) Breastfeeding in the 21st century: epidemiology, mechanisms, and lifelong effect. The Lancet Series: Breastfeeding 1. Volume 387, No. 10017, p475–490, 30 January↩︎

  48. Wandsworth has seen an overall improvement in 6–8 weeks prevalence rates between 2018 to 2019 from 26% in Q1 to 79% in Q4 . The overall total for the year is 56% which is higher than England average↩︎

  49. PHE. Everybody active, every day: framework for physical activity. 2019. URL: https://www.gov.uk/government/publications/everybody-active-every-day-a-framework-to-embed-physical-activity-into-daily-life↩︎

  50. Department for Education. SEN statistics. 2020. URL: https://explore-education-statistics.service.gov.uk/find-statistics/special-educational-needs-in-england↩︎

  51. Public Health England. A framework for supporting teenage mother & young fathers. 2019, URL: https://www.gov.uk/government/publications/teenage-mothers-and-young-fathers-support-framework↩︎

  52. Hagell A and Shah R. Key Data on Young People 2019. London: Association for Young People’s Health. 2019.↩︎

  53. PHE: Sexually transmitted infections and screening for Chlamydia in England, 2019. URL: https://assets.publishing.service.gov.uk/government/uploads/system/uploads/attachment_data/file/914249/STI_NCSP_report_2019.pdf↩︎

  54. Section 20: Local Authority needs to provide accommodation to children under the age of 18.↩︎

  55. BECOME. About the Care System [online]. URL: https://www.becomecharity.org.uk/care-the-facts/about-the-care-system/↩︎

  56. Department for Education. Outcomes for children looked after by Local Authorities in England: 31 March 2019. LAC Outcomes 2019↩︎

  57. Wandsworth Clinical Commissioning Group. Looked After Children Annual Report Wandsworth 2019/20.↩︎

  58. St George’s University Hospitals NHS Foundation Trust. Looked After Children’s Health Team Annual Report 2018/19.↩︎

  59. Wandsworth Clinical Commissioning Group. Looked After Children Annual Report Wandsworth 2018/19.↩︎

  60. Simmonds, J., Merredew, H. The Health Needs of Unaccompanied Asylum Seeking Children and Young People [online]. British Association for Adoption and Fostering. 2020. URL: https://www.nice.org.uk/guidance/ph28↩︎

  61. St George’s University Hospitals NHS Foundation Trust. Looked After Children’s Health Team Annual Report 2018/19↩︎

  62. Wandsworth Clinical Commissioning Group. Looked After Children Annual Report Wandsworth 2018/19.↩︎

  63. National Institute for Health and Care Excellence. Looked after children and young people. Public Health Guideline [PH28]. 2015. URL: https://www.nice.org.uk/guidance/ph28↩︎

  64. Department for Education. 2010 to 2015 government policy: looked after children and adoption, May 2015.↩︎

  65. National Institute for Health and Care Excellence. Looked after children and young people [online]. Public Health Guideline [PH28]. 2015. URL: https://www.nice.org.uk/guidance/ph40↩︎

  66. National Institute for Health and Care Excellence. Looked after children and young people. Public Health Guideline [PH28]. 2015. URL: https://www.nice.org.uk/guidance/ph28↩︎

  67. National Institute for Health and Care Excellence. Looked after children and young people. Public Health Guideline [PH28]. 2015. URL: https://www.nice.org.uk/guidance/ph28↩︎

  68. National Institute for Health and Care Excellence. NICE Qs the health and well-being of looked after children and young people. Shared learning database. Action for Children-Two of a Kind. 2014. URL: https://www.nice.org.uk/sharedlearning/nice-qs-the-health-and-well-being-of-looked-after-children-and-young-people↩︎

  69. National Institute for Health and Care Excellence. Looked after children and young people. Public Health Guideline [PH28]. 2015. URL: https://www.nice.org.uk/guidance/ph28↩︎

  70. Legislation.gov.uk. Children and Families Act 2014. PART 3, 2020. URL: https://www.legislation.gov.uk/ukpga/2014/6/part/3↩︎

  71. Legislation.gov.uk. Children Act 1989, 2020. URL: https://www.legislation.gov.uk/ukpga/1989/41/contents↩︎

  72. Department for Education and Department of Health. Special educational needs and disability code of practice: 0–25 years. 2015. URL: https://assets.publishing.service.gov.uk/government/uploads/system/uploads/attachment_data/file/398815/SEND_Code_of_Practice_January_2015.pdf↩︎

  73. Legislation.gov.uk. Children and Families Act 2014. PART 3. 2020. URL: https://www.legislation.gov.uk/ukpga/2014/6/part/3↩︎

  74. NSPCC Learning. Looked after children, 2019. URL: https://learning.nspcc.org.uk/children-and-families-at-risk/looked-after-children#:~:text=A%20child%20who%20has%20been,children%20and%20young%20people%20prefer.&text=But%20in%20general%2C%20looked%20after,living%20with%20foster%20parents↩︎

  75. Davies, G. National Audit Office. Support for pupils with special educational needs and disabilities in England. 2019. URL: https://www.nao.org.uk/wp-content/uploads/2019/09/Support-for-pupils-with-special-education-needs.pdf↩︎

  76. Department for Education and Department of Health. Special educational needs and disability code of practice: 0–25 years. 2015. URL: https://assets.publishing.service.gov.uk/government/uploads/system/uploads/attachment_data/file/398815/SEND_Code_of_Practice_January_2015.pdf↩︎

  77. Department for Education. Special educational needs in England: January 2019. URL: https://assets.publishing.service.gov.uk/government/uploads/system/uploads/attachment_data/file/814244/SEN_2019_Text.docx.pdf↩︎

  78. Department for Education. National tables: Special educational needs in England: January 2019. All Schools: number of pupils with special educational needs, based on where the pupil attends school. 2019.↩︎

  79. Department for Education. Main tables: Schools, pupils and their characteristics 2020. Local Authority cross border movement of special school pupils. 2020.↩︎

  80. Wandsworth Borough Council – Research and Evaluation Unit. Outcomes for Pupils with SEND 2019. 2019.↩︎

  81. Department for Education. National tables: Special educational needs in England: January 2019. All Schools: number of pupils with special educational needs, based on where the pupil attends school. 2019.↩︎

  82. Department for Education. Main tables: Schools, pupils and their characteristics 2020. Local Authority cross border movement of special school pupils. 2020.↩︎

  83. Gov.uk. School leaving age. 2020. URL: https://www.gov.uk/know-when-you-can-leave-school↩︎

  84. Department for Education. Main tables: Schools, pupils and their characteristics 2019. Number of pupils by type of school. 2019.↩︎

  85. World Health Organisation. Social determinants of health. 2020. URL: World Health Organisation. Social determinants of health. 2020. URL: https://www.who.int/teams/social-determinants-of-health↩︎

  86. Office of National Statistics. Live births by mother’s usual area of residence. 2016.↩︎

  87. Office of National Statistics. Birth Characteristics in England and Wales. 2018↩︎

  88. NHS. What are the health risks of smoking? 2018. URL: https://www.nhs.uk/common-health-questions/lifestyle/what-are-the-health-risks-of-smoking/↩︎

  89. Department for Education. National tables: Special educational needs in England – January 2019. Table 6 State-funded primary, secondary and special schools: number of pupils with special educational needs by ethnic group. 2019.↩︎

  90. DataWand. Deprivation. Children in low-income families. URL: https://www.datawand.info/deprivation/#/view-report/8b97d75c317745b3a6016fc0788469d1/___iaFirstFeature/G3↩︎

  91. Department for Education and Department of Health. Special educational needs and disability code of practice: 0–25 years. 2015. URL: https://assets.publishing.service.gov.uk/government/uploads/system/uploads/attachment_data/file/398815/SEND_Code_of_Practice_January_2015.pdf↩︎

  92. Wandsworth Borough Council – Research and Evaluation Unit. SEN need types by ethnicity and deprivation. 2018.↩︎

  93. Parsons, S., and Platt, P. Disability among young children: Prevalence, heterogeneity and socioeconomic disadvantage. London: Institute of Education, University of London. 2013.↩︎

  94. Department for Education. Children in need of help and protection: Data and analysis, March 2018.↩︎

  95. Department for Education and Ministry of Justice. Understanding the educational background of young offenders. Joint experimental statistical report from the Ministry of Justice and Department for Education. 2016.↩︎

  96. Department for Education. Main tables: Schools, pupils and their characteristics 2020. Local Authority cross border movement of special school pupils. 2020.↩︎

  97. Department for Education. Main tables: Schools, pupils and their characteristics 2020. Local Authority cross border movement of special school pupils. 2020.↩︎

  98. Department for Education. Main tables: Schools, pupils and their characteristics 2020. Local Authority cross border movement of special school pupils. 2020.↩︎

  99. Little M, McLennan JD. Teacher perceived mental and learning problems of children referred to a school mental health service. J Can Acad Child Adolescence Psychiatry. 2010;19(2):94–99. PMID: 20467545↩︎

  100. Department for Education. Special educational needs in England: January 2019. URL: https://assets.publishing.service.gov.uk/government/uploads/system/uploads/attachment_data/file/814244/SEN_2019_Text.docx.pdf↩︎

  101. Department for Work and Pensions. Family Resources Survey. URL: https://www.gov.uk/government/collections/family-resources-survey--2↩︎

  102. National Autistic Society. Autism facts and history. URL: https://www.autism.org.uk/advice-and-guidance/what-is-autism/the-history-of-autism↩︎

  103. Slade, G. National Autistic Society. Diverse perspectives – The challenges for families affected by Autism from Black, Asian, and Minority Ethnic communities. 2014.↩︎

  104. Department for Education. Local authority tables: Special education needs in England 2019. Number and percentage of pupils with special educational needs by primary type of need. 2019.↩︎

  105. University of Oxford. Ethnic disproportionality in the identification of Special Educational Needs (SEN): Wandsworth Local Authority Feedback Pack. URL: https://www.education.ox.ac.uk/wp-content/uploads/2019/01/Wandsworth-LA-pack.pdf↩︎

  106. Department for Education. National tables: Special educational needs in England – January 2019. Table 6 State-funded primary, secondary and special schools: number of pupils with special educational needs by ethnic group. 2019.↩︎

  107. Department for Education. National tables: Special educational needs in England – January 2019. Table 6 State-funded primary, secondary and special schools: number of pupils with special educational needs by ethnic group. 2019. URL: Department for Education. National tables: Special educational needs in England – January 2019. Table 6 State-funded primary, secondary and special schools: number of pupils with special educational needs by ethnic group. 2019.↩︎

  108. Department for Education. Main tables: Schools, pupils and their characteristics 2020. Local Authority cross border movement of special school pupils. 2020.↩︎

  109. Department for Education. Additional tables: Special educational needs in England – January 2019. Table F – State-funded primary, secondary and special schools: number and percentage of pupils with special educational needs by first language and primary type of need. 2019.↩︎

  110. Rosamond, S., Bhatti, I., Sharieff, M., Wilson, K. Distinguishing the difference SEN or EAL? An effective step-by-step procedure for identifying the learning needs of EAL pupils causing concern. Birmingham Advisory and Support Service. Birmingham. 2003.↩︎

  111. Department for Education. Key Stage 2 and multi-academy trust performance, 2018 (revised). Attainment of pupils at the end of key stage 2 in reading, writing and maths by SEN provision and local authority. 2018.↩︎

  112. Department for Education. Main text: Statements of SEN and EHC Plans: England 2019.↩︎

  113. Department for Education. Main tables: Statements of SEN and EHC Plans: England 2019. Table 5b: Placement (%) of children and young people with an EHC plan by local authority. 2019.↩︎

  114. Department for Education. Level 2 and 3 attainment by young people aged 19 in 2018. Percentage of 19-year-olds qualified to Level 2 with English and Maths, by special educational need (SEN) status in Year 11 and Local Authority↩︎

  115. Department for Education. Pupil absence in schools in England: 2017 to 2018. Table 9: Pupil absence by type of school. 2018.↩︎

  116. Legislation.gov.uk. Care Act 2014. URL: https://www.legislation.gov.uk/ukpga/2014/23/contents/enacted↩︎

  117. Department of Health & Social Care. Care Act 2014: supporting implementation. Care and support statutory guidance. 2018. URL: https://www.gov.uk/government/publications/care-act-statutory-guidance/care-and-support-statutory-guidance↩︎

  118. National Institute for Health and Care Excellence. NICE guidance: Autism spectrum disorder in under 19s: support and management. Clinical guideline (CG170). 2013. URL: https://www.nice.org.uk/guidance/cg170↩︎

  119. National Institute for Health and Care Excellence. NICE guidance: Autism spectrum disorder in under 19s: recognition, referral and diagnosis. Clinical guideline (CG128). 2017. URL: https://www.nice.org.uk/guidance/cg128↩︎

  120. National Institute for Health and Care Excellence. NICE guidance: Learning disabilities and behaviour that challenges: service design and delivery. NICE guideline (NG93). 2018. URL: https://www.nice.org.uk/guidance/ng93↩︎

  121. National Institute for Health and Care Excellence. NICE guidance: Social and emotional well-being: early years. Public health guideline (PH40). 2012. URL: https://www.nice.org.uk/guidance/ph40↩︎

  122. Carroll et al., SEN support: A rapid evidence assessment, Research Report↩︎

  123. Islington Directory. SEND Parent Consultants. 2020↩︎

  124. Hagell A and Shah R (2019) Key Data on Young People 2019. London: Association for Young People’s Health.↩︎

  125. Alcohol also increases the risk of sexual aggression, sexual violence and sexual victimisation of women.↩︎

  126. Hagell A and Shah R (2019) Key Data on Young People 2019. London: Association for Young People’s Health.↩︎

  127. NHS Digital (2019). Statistics on Drug Misuse: Part 4- Drug use among young people. URL: https://digital.nhs.uk/data-and-information/publications/statistical/statistics-on-drug-misuse/2019/part-4-drug-use-among-young-people↩︎

  128. NHS Digital (2018). Statistics on Alcohol: Part 5- Drinking behaviours among children. URL: https://digital.nhs.uk/data-and-information/publications/statistical/statistics-on-alcohol/2018/part-5↩︎

  129. Home Office (2019). National Statistics – Drug misuse: findings from the 2018 to 2019 CSEW. URL: https://assets.publishing.service.gov.uk/government/uploads/system/uploads/attachment_data/file/832533/drug-misuse-2019-hosb2119.pdf↩︎

  130. DoH. A Framework for Sexual Health Improvement in England. URL: https://assets.publishing.service.gov.uk/government/uploads/system/uploads/attachment_data/file/142592/9287-2900714-TSO-SexualHealthPolicyNW_ACCESSIBLE.pdf↩︎

  131. Wandsworth Safeguarding Children Partnership. URL: http://wscp.org.uk/↩︎

  132. The Government has said that everyone has a role to play in reducing the harmful use of alcohol - this indicator is one of the key contributions by the Government (and the Department of Health) to promote measurable, evidence-based prevention activities at a local level, and supports the national ambitions to reduce harm set out in the Government’s Alcohol Strategy. Alcohol-related admissions can be reduced through local interventions to reduce alcohol misuse and harm.↩︎