JSNA Protect Well
1. Summary
This chapter is a brief analysis of the impact COVID-19 has had on the borough’s residents. The findings are based on data from the PHE Situational Awareness Explorer dashboard, DAE (Data Access Environment) hospital admissions and the Primary Care Mortality database. It provides a brief overall picture on COVID-19 cases, hospitalisation, deaths and vaccinations from March 2020 to June 2021, and those most affected based on their demographics.
This report shows that COVID-19 does not affect all population groups equally. Local analysis, similarly to the analyses at a regional and national level, shows that the individuals in older age groups, ethnic minority groups, older men and those living in areas of higher deprivation were at greater risk of worst outcomes from COVID.
Since the start of the pandemic and up to the end of May 2021, Wandsworth borough had 22,561 cases of COVID-19, 2,215 hospital admissions with either confirmed or suspected COVID-19 and 505 registered deaths. Locally the rates of case, hospitalisation and deaths have been lower than London and England.
- There were more cases of COVID-19 in females aged under 60 years compared to males, but more cases in males aged over 60 compared to females. Men were more likely to be admitted to hospital for COVID-19 compared to women and were more likely to die from the virus.
- The Asian and Black ethnic population were more at risk of testing positive for the virus compared to all other ethnic groups; more likely to be admitted to hospital (especially among the older age groups) for COVID and die from it. The Black ethnic group, particularly the African and Caribbean population, and mixed ethnic population living in the borough were also seen to have the lowest uptake of COVID-19 vaccination.
- The more deprived areas of the borough were worst affected by the virus and hospital admissions for COVID-19 were highest in the older age groups living within those areas, with over 70% of COVID-19 hospital admissions seen within those aged 50+ years. Residents living in deprivation , especially within the wards of Roehampton, Tooting and Latchmere, were more likely to die from the virus. The more deprived areas of the borough also saw lower uptakes of COVID-19 vaccinations.
- Vaccination uptake is lower among younger age groups, those living in areas of higher deprivation, and among black ethnic group.
Source: GOV.UK. UKHSA data dashboard.
The figures below show how cumulative rates of COVID-19 cases and deaths evolved over time.
Source: GOV.UK. UKHSA data dashboard.
Source: GOV.UK. UKHSA data dashboard.
2. COVID-19 Cases in Wandsworth
The first confirmed case of COVID-19 in London was detected on the 12th February 2020. By mid-March there had been 1,069 cases confirmed across London, 240 individuals admitted into hospital and 37 deaths to people who had had a positive test result for COVID-19 and died within 28 days of the first positive test GOV.UK. UKHSA data dashboard.
COVID-19 cases in Wandsworth were analysed using Public Health England’s situational awareness explorer dashboard . Between 1st March 2020 and 31st May 2021, there were a total of 22,561 cases recorded in the borough (16% of cases were identified through Pillar 1 testing; 84% of cases were identified through Pillar 2 testing); with a near even split in cases between males and females. 1% of cases did not have gender recorded.
2.1 Trend of Positive Cases Over Time
The figure below shows the monthly rate of positive COVID-19 cases between 2020 and 2023, Wandsworth’s rate of cases peaked in December 2021 (8,725/100,000) and had not exceeded the rate of 1% of the population since March 2022.
Source: GOV.UK. UKHSA data dashboard.
2.2 Positive Cases by Age and Gender
The figure below shows the rate of cases per 100,000 by age band. By May 2021, there were more cases of COVID-19 among females in Wandsworth compared to male (n=11,829 versus 10,521 respectively).
All case rates exceeded 1,000/100,000 across all age groups in the borough, between March 2020 and May 2021. The highest rate of cases was seen within the 20–29-year-olds followed by the 80+ age group.
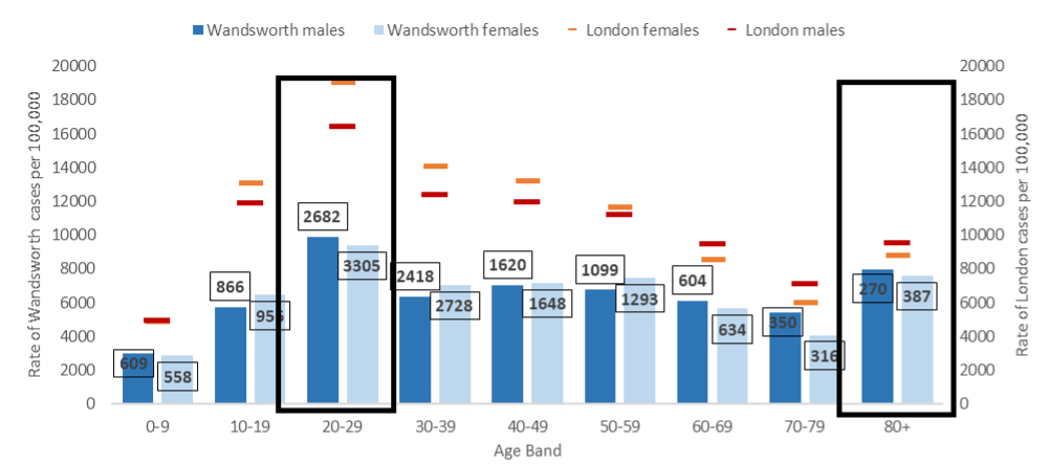
Source: Wandsworth rates: Public Health England COVID-19 Situational Awareness Explorer (March 2020-May 2021). Using GLA 2018-based Housing-Led Borough Projections *London rates: GOV.UK. UKHSA data dashboard, Coronavirus in the UK (March 2020-September 2021). Using GLA 2018-based Housing-Led Borough Projections.
Across London and England Covid-19 rates of cases in females were high compared to males in those aged under 60 years 1. Among borough residents aged 60+ years, diagnosis rates were higher in males compared to females, which has also been observed across London.
2.3 Positive Cases by Ethnicity
The COVID-19 pandemic has had a disproportionate impact on ethnic minority communities who have experienced higher COVID-19 burden. Available evidence suggests a complex interplay of deprivation, environmental, and health-related behaviours. Ethnic minority groups are disproportionately affected by socio-economic deprivation, a key determinant of health status in all communities, but it is not clear if this holds true equally for every ethnic group 2. Ethnic minority groups generally tend to live in multigenerational or overcrowded households and have frontline key worker jobs which put them at higher risk of being exposed to the virus. People from minority ethnic groups are also more likely than people of White British ethnicity to be born abroad which means they may face additional barriers (e.g. language) in navigating health and care services 3. Analysis shows London’s Asian populations have been worst affected, especially during the second wave of the pandemic (1st September 2020 to 22nd May 2021), followed by Black communities 4.
Source: Public Health England COVID-19 Situational Awareness Explorer. Using GLA 2016 -based Housing-Led Ethnic Group Projections
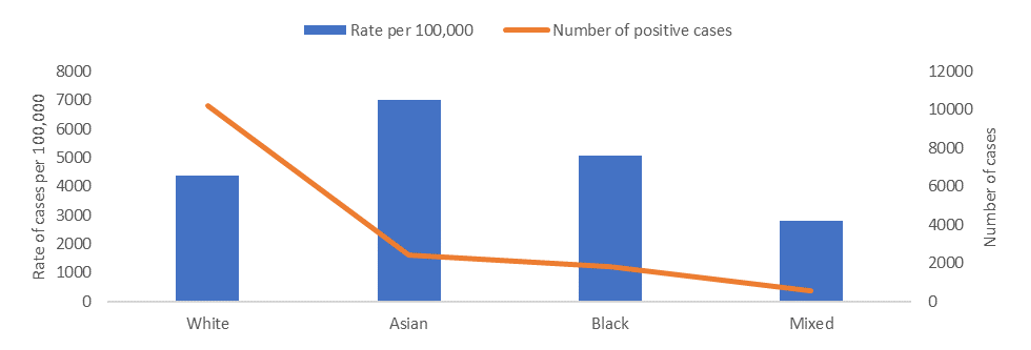
Ethnic minority groups accounted for 40% (n= 6,685) of COVID-19 cases in Wandsworth between March 2020 and May 2021 5. In comparison, this percentage was higher than the average borough proportion of ethnic minority residents of 30%. The figure above shows Wandsworth’s Asian population (n=2,410) were most affected by COVID-19 (with the Bangladeshi followed by Pakistani population having highest rates of infection), followed by Black ethnic groups (n=1,821) (mainly the Caribbean population). This is similar to the picture seen across London 6. There were 1,875 cases allocated to ‘Other’ ethnic group which also included Arab 7.
2.4 Positive Cases by Deprivation
Coronavirus case rates in London were highest among people living in the most deprived areas throughout the pandemic and this was also observed locally.
The figure below 8 shows that within more deprived areas (IMD decile 2 to 5), the proportion of COVID-19 cases are disproportionality higher than the borough’s population size. A report by University College London stated that people living in the most deprived areas are less likely to be able to work from home and are more reliant on public transport which puts them at greater risk of exposure to COVID-19 9.
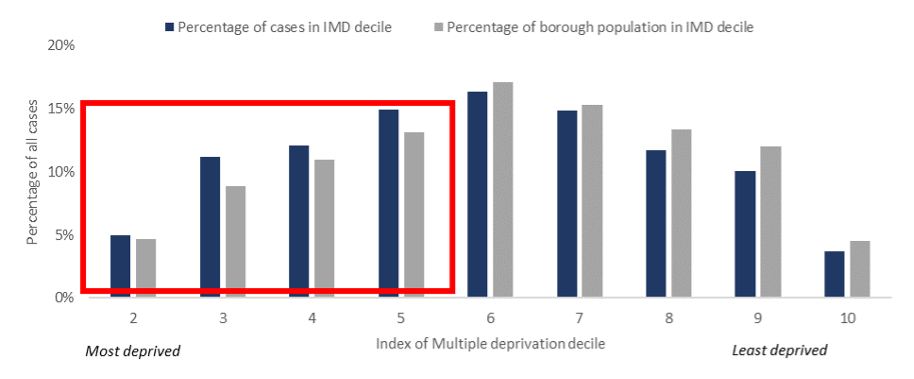
Source: Public Health England COVID-19 Situational Awareness Explorer. Using ONS Mid-2019 Annual Small Area Population Estimates and English Indices of Deprivation 2019.
The figure below shows the rate of cases per 100,000 across Pillar 1 and Pillar 2 testing combined. Overall, the borough’s rate of cases between March 2020 and May 2021 of 6,785/100,000, was lower than the London rate of 8,112/100,000. The highest rates of cases were seen within LSOAs in Tooting, Graveney, Furzedown, Queenstown, St Mary’s Park, Roehampton and Latchmere wards. Parts of these wards also have some of the most deprived LSOAs with some residents having the highest clinical needs. Tooting, Furzedown and Graveney wards tend to have higher prevalence of diabetes and heart disease 10. Queenstown, St Mary’s Park and Latchmere wards have high prevalence of respiratory diseases as well as other conditions such as cancer and chronic kidney disease. Roehampton ward is also one of Wandsworth’s most deprived wards and has a high prevalence of residents with chronic kidney disease, COPD and coronary heart disease.
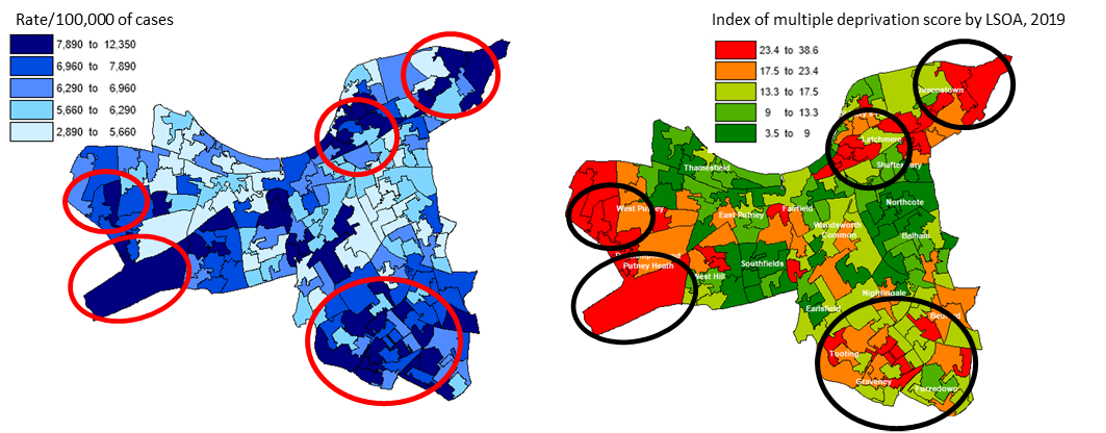
Source: Public Health England COVID-19 Situational Awareness Explorer. Using ONS 2019 mid-year population estimates.
3. Hospital Admissions
HES (hospital episode statistics) 11 data was used to analyse the number and characteristics of Wandsworth residents admitted to hospitals 12 with COVID-19 between March 2020 to March 2021. Data on hospital admissions with confirmed or suspected COVID-19 diagnosis was extracted using the following ICD 10 codes: U071 and U072. Data extracted from HES was limited to any admissions where either ICD 10 codes, U071 or U072, was mentioned within any of the number of diagnosis records of the patient.
68% of admitted COVID-19 patients had a primary diagnosis (main diagnosis) of either confirmed or suspected COVID-19 (the majority of which was confirmed).
The majority (58%) of Wandsworth residents, who were admitted to hospitals with COVID-19, attended a Wandsworth hospital trust for treatment, while 18% attended Kensington and Chelsea, followed by Kingston trust.
3.1 Trend in Hospital Admissions Over Time
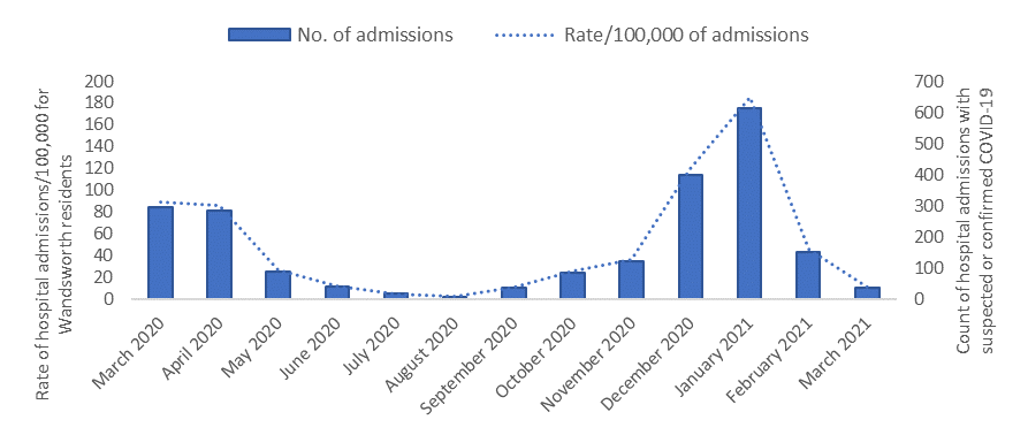
Between March 2020 and March 2021, 2,215 Wandsworth residents were hospitalised with either confirmed or suspected COVID-19. The overall borough rate of 666/100,000 was lower than the London rate of 814/100,000 13 and the England rate of 708/100,000 14.
The figure below shows the trend in hospital admissions seen within Wandsworth. The trend seen here is similar to that seen across London, and elsewhere in the country, with hospitalisation peaks tracked following peaks in the number of cases.
In March 2020, Wandsworth saw its first peak of hospital admissions with 297 patients admitted. Following on from the implementation of the first national lockdown on 23rd March 2020, Wandsworth began to see a decline in COVID-19 hospital admission numbers from May onwards. However, from September 2020 the number of hospital admissions began to rise again and reached its peak in January 2021 where the borough saw 615 residents admitted for COVID-19 during that month. This rise in admissions may have been the result of some restrictions having been lifted in July- where pubs, restaurants, hotels and hairdressers were allowed to open and two households were able to meet indoors.
Source: Data Access Environment (hospital admissions). Data extracted 30th June 2021. Using GLA 2018-based Housing-Led Borough Projections
3.2 Hospital Admissions by Age and Sex
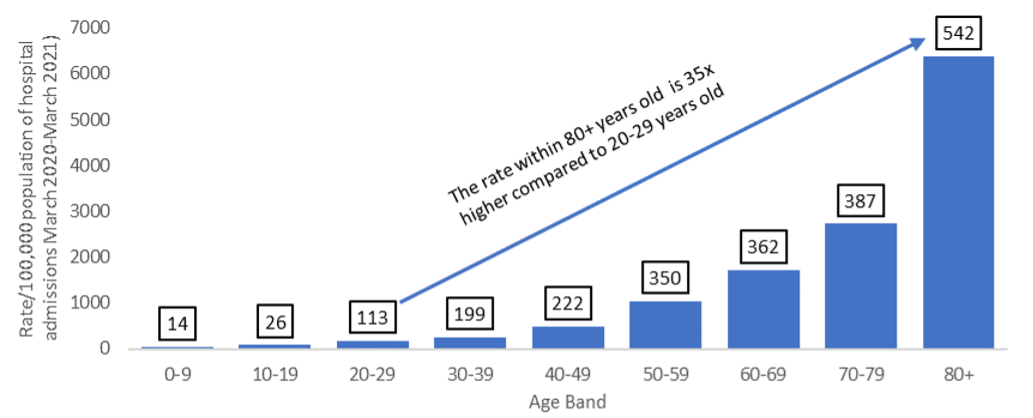
Since the start of the pandemic, hospital admission rates across London for COVID-19 were higher within the 85+ year old cohort (8,185/100,000) compared to all other age groups 15; this was similar to what was seen across England 16.
In Wandsworth, hospital admissions for COVID-19 were highest in the older age groups with over 70% of admissions seen within those aged 50+ years (the figure below).
Source: HES (hospital episode statistics)). Data extracted 30th June 2021. Using GLA 2018-based Housing-Led Borough Projections
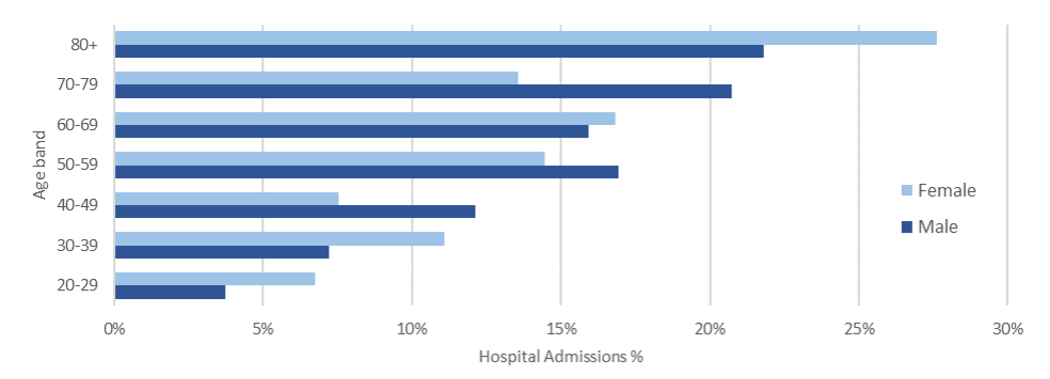
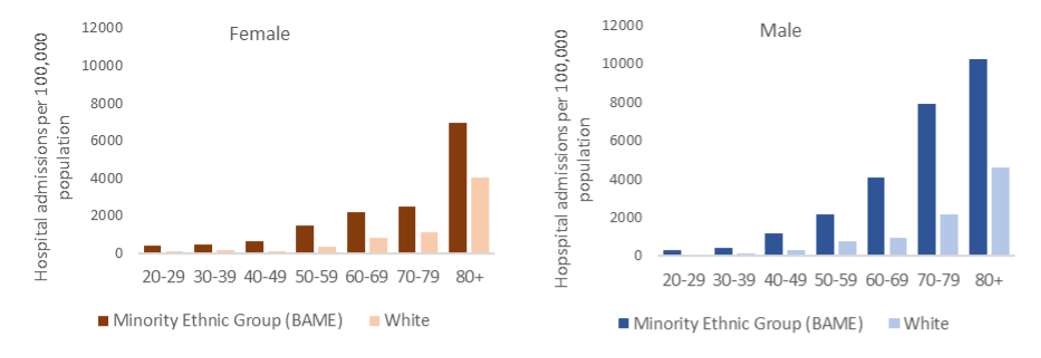
Overall, there were more COVID-19 hospital admissions amongst males (54%) compared to females (46%). COVID-19 diagnosis rates increased with age for both genders (the figure below). Hospitalisation was higher among males aged between 40-79 years compared to females; 66% versus 52%. However, the chart also shows that among the 80+ year olds, hospitalisation was higher among females, 28%, compared to males.
Source: Data Access Environment (hospital admissions). Data extracted 30th June 2021
3.3 Hospital Admissions by Ethnicity
People from minority ethnic groups were more severely affected by COVID-19 and have a three-fold higher risk of requiring hospitalisation once infected with the virus compared to the White ethnic groups 17.
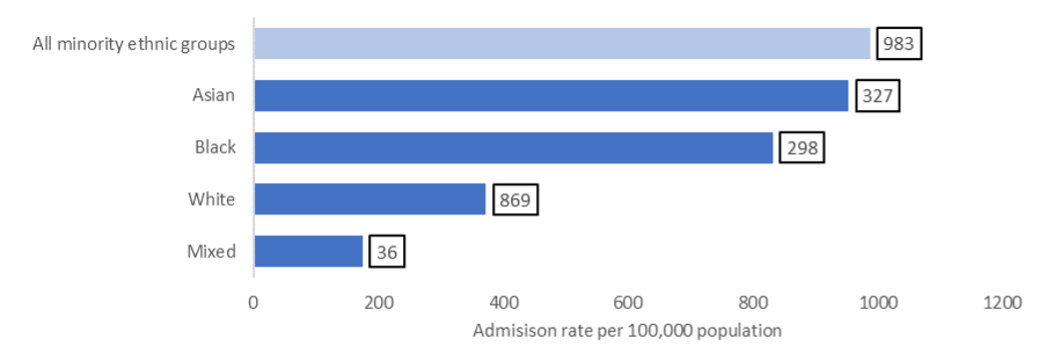
The ethnicity of patients admitted to hospital with either confirmed or suspected COVID-19 was analysed. 16% of hospital admissions did not have ethnicity recorded and therefore were excluded from the following analysis. Where ethnicity was recorded, minority ethnic groups 18 accounted for 53% of hospital admissions (30% of local population is from minority ethnic groups), compared to 47% of White ethnic group, showing that there were a greater proportion of ethnic minority population with clinical need.
The figure below shows the rate of hospitalisation among minority ethnic groups and White ethnic group. There was a total number of 983 hospital admissions of minority ethnic groups, compared to 869 admissions of residents from White ethnic group. The Asian, particularly the Bangladeshi population, and Black ethnic groups, particularly the Caribbean population, had the highest admission rates between March 2020 and March 2021. This was similar to what was seen across England with the Black and Asian ethnic groups having higher hospital admission rates compared to all other ethnic groups 19. The lowest rate of admissions was seen within those from a mixed ethnic background. There were 322 admissions in patients from ‘Other’ ethnic group 20.
Source: Data Access Environment (hospital admissions). Data extracted 30th June 2021. Using GLA 2016-based Housing-Led Ethnic Group Projections.
Source: Data Access Environment (hospital admissions). Data extracted 30th June 2021. GLA 2016-based Housing-led Ethnicity 2020 estimates.
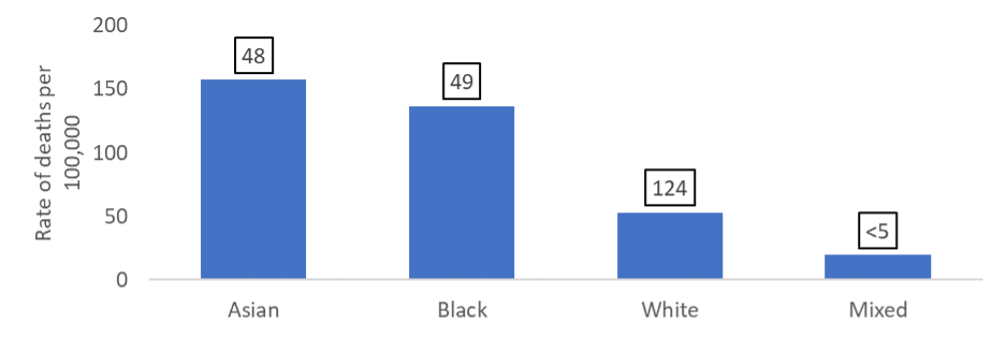
The figure above shows that hospitalisation was higher among older aged minority ethnic groups, especially males. Of the 2,215 hospital admissions involving confirmed or suspected COVID-19; 388 (17%) of patients died in hospital. Of those deaths, 80% had a primary diagnosis of either suspected or confirmed COVID-19; with males accounting for 59% of deaths and females 41% of deaths. Death rates were highest among Asian ethnic group (the highest being within the Bangladeshi population), followed by Black ethnic group (the highest being in the Caribbean population). The lowest rate of deaths was among those from mixed ethnic backgrounds and White ethnic groups. There were 36 deaths from patients of Other ethnic groups (as shown below).
Source: Data Access Environment (hospital admissions). Data extracted 30th June 2021. GLA 2016-based Housing-led Ethnicity 2020 estimates.
3.4 Hospital Admissions by Deprivation
People who live in areas of higher deprivation are more likely to be admitted to hospital due to Covid- 19. In England, official analysis of patients admitted to hospital with COVID-19 reported that 45% of patients were from the most deprived 20% of the population 21.
The figure below shows that the highest rates of hospital admissions (dark blue areas on the map on the left) were from areas which were also the most deprived in the borough (red areas on the map on the right).
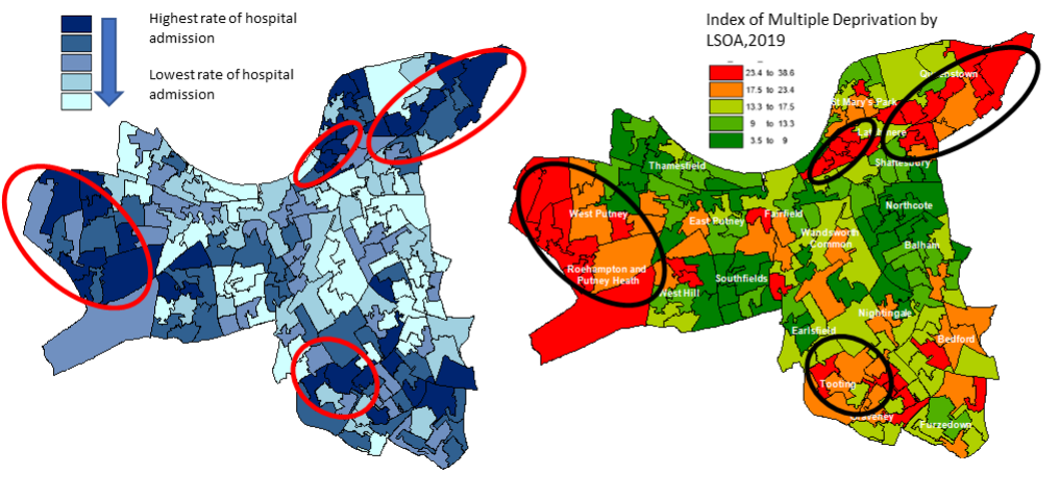
Source: HES (hospital episode statistics). Data extracted 30th June 2021. Using ONS Mid-2019 Annual Small Area Population Estimates and English Indices of Deprivation 2019.
The figure below shows Wandsworth residents who live in the most deprived areas of the borough were over three times more likely to be admitted to hospital with COVID-19 compared to those living in the least deprived areas of the borough 22.
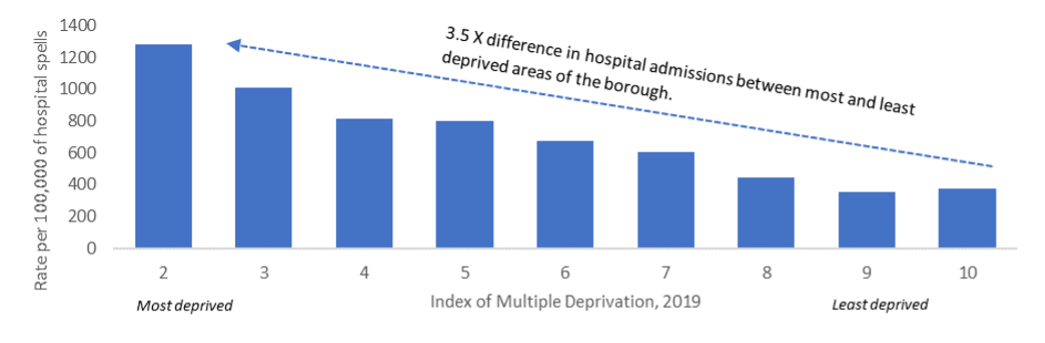
Source: Data Access Environment (hospital admissions). Data extracted 30th June 2021. Using ONS Mid-2019 Annual Small Area Population Estimates and English Indices of Deprivation 2019.
4. Mortality from COVID-19
Mortality data was extracted from the Primary Care Mortality Database (PCMD); which is managed by NHS Digital. They use monthly death records from the Office of National Statistics (ONS) which is based on registered deaths.
Analysis was carried out where there was any mention of COVID-19 on the individual’s death certificate and covered the time period of February 2020 to May 2021. Of the 2,288 registered deaths in Wandsworth, 452 (20%) had COVID-19 listed as their underlying cause of death. Locally, 78% (n=354) of deaths from COVID-19 occurred in hospitals; 10% (n=46) occurred in care homes and 9% (n=40) within the patient’s own home. All other deaths took place in other settings such as hospices.
4.1 Trend in Mortality Over Time
Between March 2020 and June 2023 there were 675 Wandsworth’s COVID-19 deaths, there were 452 COVID-19 related deaths (205/100,000) registered to Wandsworth residents (the figure below), which was lower than the London rate of 260/100,000 and England rate of 341/100,000 23. The peaks in deaths in the chart below followed local peaks in cases and hospitalisations, and period of highest COVID-19 deaths were same as London and England.
Source: GOV.UK. UKHSA data dashboard.
4.2 Mortality by Age and Sex
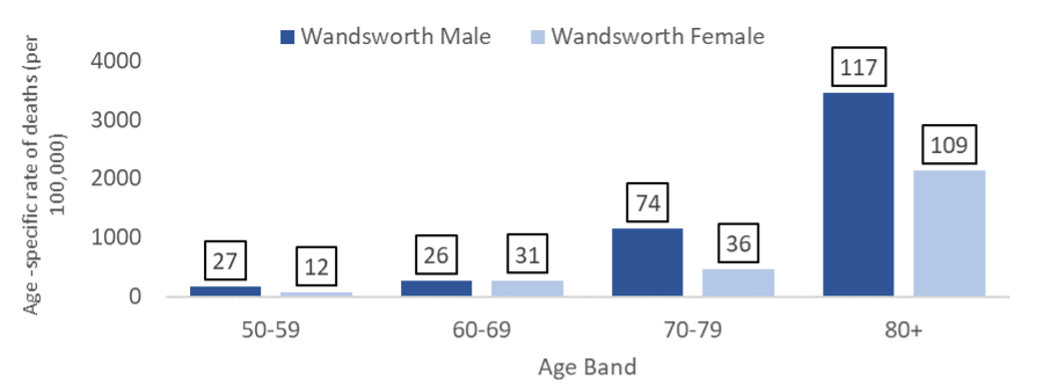
Of the 452 COVID-19 related deaths in the borough, 432 were to residents aged 50+ years, and almost three-quarters (n=336) were to residents aged 70+ years. Across London and England, the greatest proportion of deaths from COVID-19 was seen within the older aged population, 70+ year olds, which peaked in April 2020 and in January 2021 24. Figure below shows the rate of deaths from COVID-19 in Wandsworth residents by age band.
Source: Primary Care Mortality Database. Using GLA 2018-based Housing-Led Borough Projections
Similar to London and England, the number of deaths were higher in males compared to females across all age groups, with the 80+ year old males having a death rate 1.5 times higher than females of the same age group.
4.3 Mortality by Deprivation
Office for National Statistics data shows that people who live in the most deprived areas of England and Wales are around twice as likely to die after contracting COVID-19 25.
In Wandsworth, residents living within the most deprived LSOAs experienced higher rates of deaths from COVID-19 compared to those living in the more affluent areas of the borough (the figure below).

Source: Primary Care Mortality Database. Using ONS Mid-2019 Annual Small Area Population Estimates and English Indices of Deprivation 2019.
The figure below shows those areas with the highest mortality rate (darker blue), are also some of the most deprived areas in the borough 26 (red areas on the Index of multiple deprivation map).
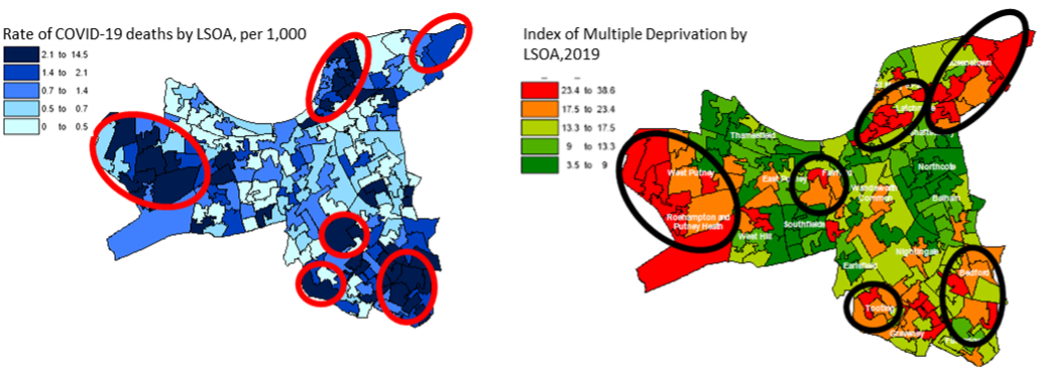
Source: Primary Care Mortality Database. Using ONS Mid-2019 Annual Small Area Population Estimates.
5. Vaccinations
COVID-19 vaccinations in Wandsworth were analysed using Public Health England’s Situational Awareness Explorer dashboard. Vaccine coverage was calculated using the Office for National Statistics (ONS) 2020 mid-year population estimate. As a result, vaccine rates and numbers reported here will differ from those published on GOV.UK because GOV.UK uses the National Immunisation Management Service (NIMS), which is based on those registered with a GP. NIMS population estimates are higher because local residents are not required to register with a local GP and people do not always update their address with their GP once they move.
It is important to note that vaccine rates calculated using these denominators should be considered as estimates, as there are issues with both denominators. The ONS estimate of residents covers population residents at a smaller area level, which leads to some coverage estimates as being an over estimate. Although 2020 mid-year population estimate has been available since June 2021, 2019 mid-year estimates were used to calculate coverage at LSOA 27 level. This was because the 2020 mid-year estimates are not yet available for regional, ICS/STP and CCG 28 geographies.
5.1 Number of COVID Vaccines Administered in Wandsworth
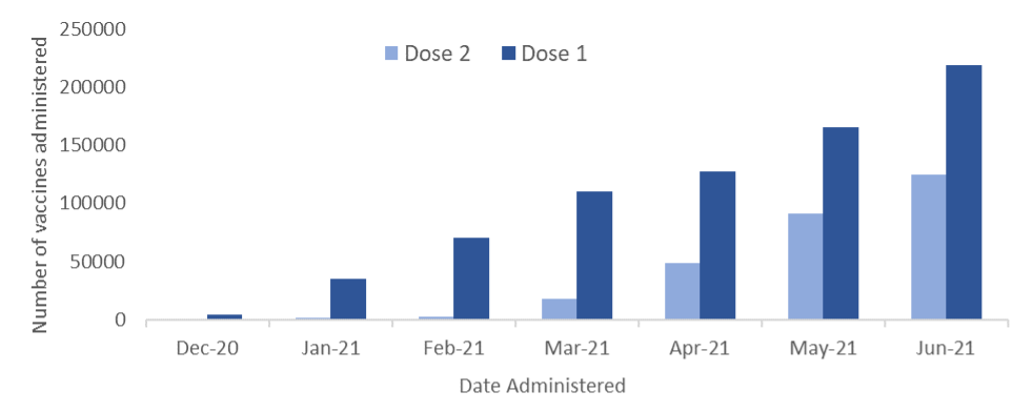
Between 8th December 2020 and 30th June 2021, a total of 218,273 dose 1 vaccinations (81%) 29. and 124,503 dose 2 vaccinations (46%) were administered to Wandsworth residents 30. Based on the ONS population estimates, 80% of Wandsworth residents had received at least one dose of a COVID-19 vaccine and 46% were fully vaccinated by June 2021. COVID-19 vaccination roll-out began in December 2020.
The figure below shows the cumulative number of COVID-19 vaccinations administered in Wandsworth over time.
For latest vaccine numbers and coverage data, visit GOV.UK.
Source: PHE Situational Explorer dashboard
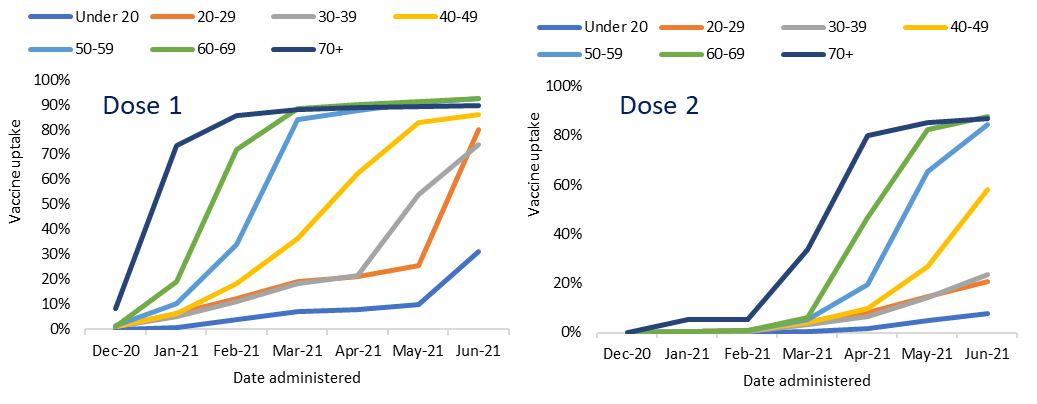
5.2 Vaccination Uptake by Age and Gender
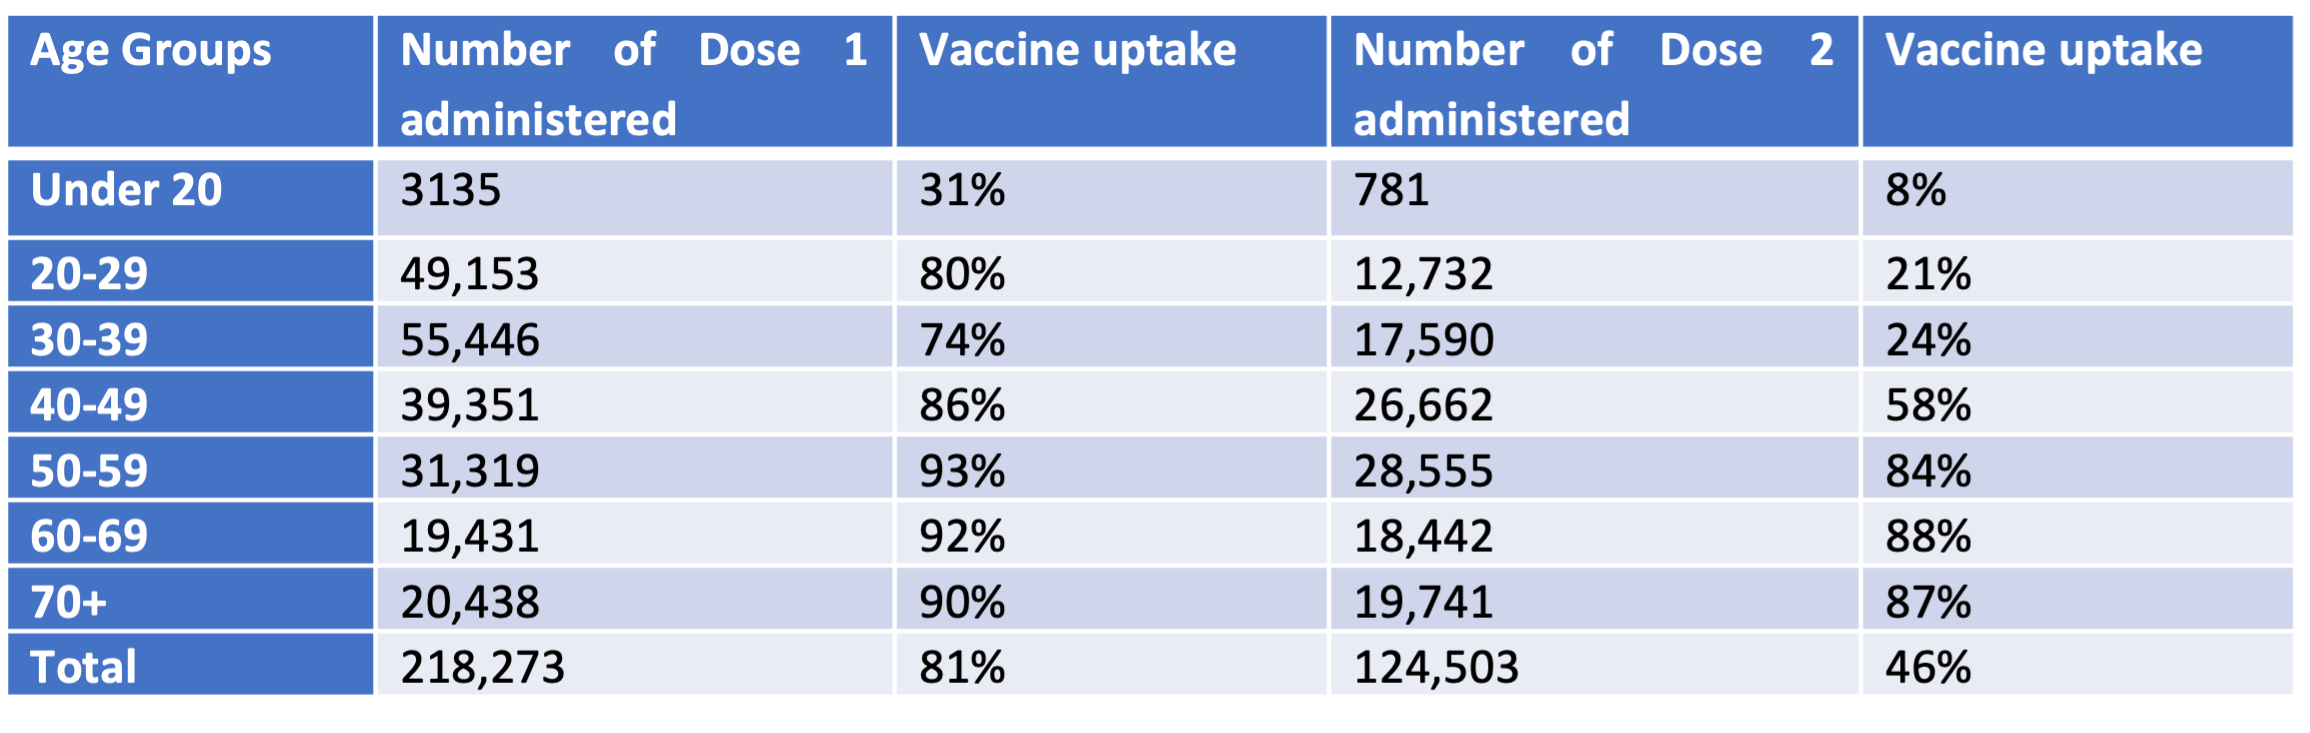
The table below above shows the number of Wandsworth residents vaccinated by age group. Over 80% of 50+ year olds were fully vaccinated by 30th June 2021. At the beginning of April 2021, the Government opened the vaccinations to individuals aged 40 and over. By the end of June, 86% of 40-49 year olds in the borough had received their 1st vaccination dose. By mid-June, those aged 21+ years could receive their COVID-19 vaccinations; and by the end of June, 80% of the borough’s 20-29 year olds cohort had received dose 1 of their vaccinations. By the end of June, dose 1 vaccine uptake among the younger age cohort was higher in females (56%) than in males (49%). However, in the older cohort (40+), males had a higher vaccine uptake (91%) than females (87%).
The uptake among younger age groups in Wandsworth has improved and latest data can be found on GOV.UK. UKHSA data dashboard.
Source: PHE Situational Explorer dashboard
Source: PHE Situational Explorer dashboard
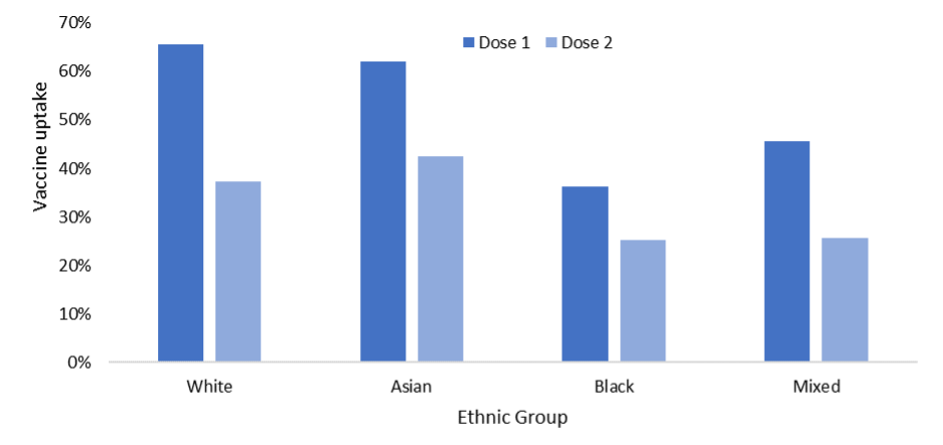
5.3 Vaccination Uptake by Ethnic Group
The figure below shows the vaccine uptake among ethnic groups in Wandsworth. 11% had no ethnicity recorded and were therefore excluded from this analysis. Dose 1 vaccine rates was highest amongst the White ethnic group (66%) followed by the Asian ethnic group (62%). The lowest uptake was seen among those from Black and Mixed ethnic groups. As of 30th of June, 50,165 (57%) ethnic minority Wandsworth residents received dose 1 of their COVID vaccinations and 32,510 (37%) received their second dose. Black ethnic groups were less likely to be vaccinated with the first dose of the vaccine (36%), particularly African (43%) and Caribbean (31%) ethnic groups compared to their White and Asian counterparts (66% and 62%). This was also observed across England and London.
Vaccine uptake among ethnic minority residents was low among LSOAs that fell within Latchmere, Roehampton and Putney Heath, Wandsworth Common, Tooting, Graveney and Balham wards. Parts of Furzedown also saw a low uptake. These areas also have a high proportion of ethnic minority population living within them and are also some of the more deprived wards in Wandsworth; the most deprived being Latchmere, Roehampton, Tooting and Graveney.
Source: PHE Situational Explorer dashboard
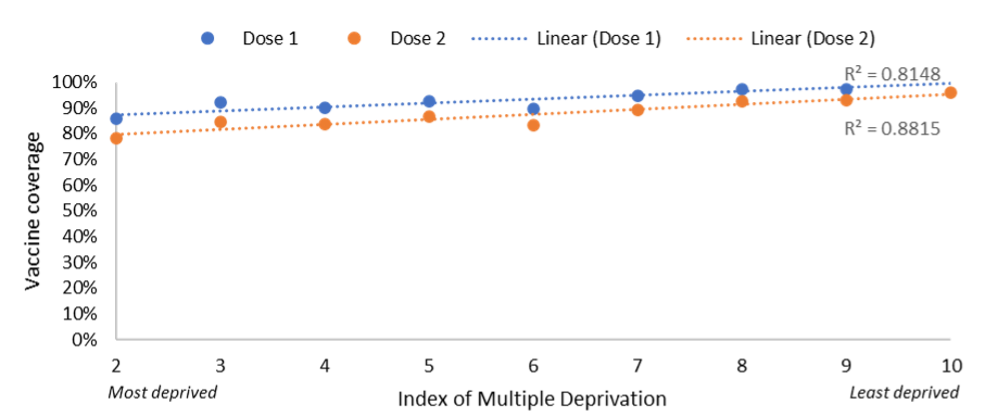
5.4 Vaccination Coverage by Deprivation
In Wandsworth, similar to London and England, vaccination coverage was lower in areas of higher deprivation.
There was a strong correlation between low vaccination coverage in those aged 50+ and those living in more deprived LSOAs of the borough. In areas of lower deprivation, coverage was 15% higher than areas of higher deprivation. This strong correlation was seen across both dose 1 and dose 2 (see the figure below).
Source: PHE Situational Explorer dashboard
6. Post COVID Syndrome
Post Covid Syndrome (PCS) is a multisystem, fluctuating condition of varying severity that has emerged over the past 2 years. The term ‘long COVID’ is commonly used to describe signs and symptoms that continue or develop after acute COVID-19. It includes both ongoing symptomatic COVID-19 (from 4 to 12 weeks) and post-COVID-19 syndrome (12 weeks or more) 31.
6.1 Post COVID Syndrome Cases in Wandsworth
Wandsworth PCS prevalence estimates are based on the UK Coronavirus (COVID-19) Infection Survey (CIS) data by the Office of National Statistics (ONS), stratified by age, sex and deprivation 32. In the UK, those with the greatest self-reported prevalence and at increased risk of PCS were:
- females,
- people aged between 35-49 years,
- living in areas of higher deprivation,
- living with comorbidities including hypertension,
- with raised cholesterol and obesity and
- working in education and healthcare.
There is unclear relationship between PCS and ethnicity, with some evidence showing PCS affects Minority ethnic groups more frequently but other research suggest that White ethnic groups are greater affected.
In Wandsworth it is estimated that 0.37% of the population is living with Long COVID, which equates to approx. 1200 cases. No local estimates of PCS for London boroughs are currently available and Wandsworth’s prevalence rate has been calculated using London-wide estimates applied to Wandsworth population 33.
6.2 Service Data
Current evidence for the management of Long COVID shows the need for a holistic, MDT led approach with shared decision making among patients and families.
Local management of PCS is via a single point of access - Post COVID assessment service (PCAS), a joint service with Merton. Data from service use from May 2021-April 2022 34 shows that there were 169 referrals, of which:
- 68% were referrals for female patients,
- Main ethnic groups of the referred patients: 33% White British, 11% British or Mixed British, 8% Other White Background,
- 59% of the referred patients lived in areas within the national IMD deciles 6-10 (least deprived 50%),
- With the highest number of referrals among patients aged 30-50.
Service uptake 35, compared with the nationally derived estimated PCS prevalence, enabled a gap analysis, which showed no large geographical gaps in service utilisation but pockets of under use. The service was utilised to a larger extent in most deprived and most affluent areas, with quintile 3 showing the lowest levels of service uptake (as shown in the figure below).
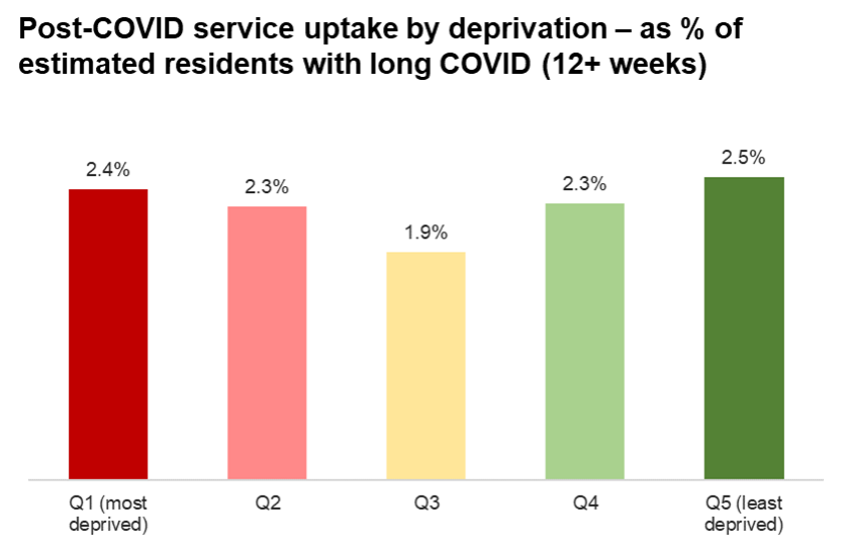
Source: NHS Central London Community Healthcare NHS Trust
6.3 Public Health Offer
Wandsworth Public Health wqw working with the Wandsworth and Merton Post COVID steering group to enhance support for case finding, assessing the equity of use of services and working to improve knowledge of the condition and services among patients and the healthcare population, looking ahead to living with covid, and recognising PCS as a long-term condition requiring a dedicated approach.
6.4 Data Limitations
The existing PCS prevalence estimates are derived from self-reported surveys and not from the clinically diagnosed ongoing COVID or post COVID syndrome. There is also a limited or low-quality evidence currently for management of long COVID that reflects the emerging nature of the condition. Finally, data assessing the activity of post covid services, relies on accurate and appropriate coding of diagnosis within patient notes by primary care professionals.
Kings Fund. The Health of People from Ethnic minority grouped in England. URL: https://www.kingsfund.org.uk/publications/health-people-ethnic-minority-groups-england↩︎
Disparities in the Risk and Outcomes of COVID-19. URL: https://assets.publishing.service.gov.uk/government/uploads/system/uploads/attachment_data/file/908434/Disparities_in_the_risk_and_outcomes_of_COVID_August_2020_update.pdf↩︎
Public Health Matters: Tackling London’s ongoing COVID-19 health inequalities. URL: https://ukhsa.blog.gov.uk/2021/02/03/tackling-londons-covid-19-health-inequalities/↩︎
Cases with unknown ethnicity were excluded from this analysis. This accounted for approximately 5,635 individuals.↩︎
Tackling London’s ongoing COVID-19 health inequalities. Public Health Matters. URL: https://ukhsa.blog.gov.uk/2021/02/03/tackling-londons-covid-19-health-inequalities/↩︎
‘Other ethnic group’ was not included in the chart as it makes up a small proportion of the population and calculating the rate would be an unreliable analysis showing over representation compared to all other ethnic groups.↩︎
The ten deprivation deciles are defined using Index of Multiple Deprivation (IMD) 2019. Each Lower Super Output Area (LSOA) in England is ranked in terms of its deprivation level and allocated to a decile (1 is most deprived, 10 is least deprived).↩︎
University College London. People in Deprived areas three times more likely to use public transport for essential travel.↩︎
DataWand. COVID-19 Vulnerabilities dashboard.↩︎
Hospital data extracted from Data Access Environment (DAE) through NHS Digital.↩︎
Hospital data analysis was based on local residents only, regardless of the hospital they attended.↩︎
London rate of hospitalisation was calculated using the number of patients admitted to hospital between March 2020 and May 2021 (n=73,216) from GOV.UK Coronavirus dashboard, and the GLA population denominator.↩︎
England rate of hospitalisation was calculated using the number of patients admitted to hospital between March 2020 and May 2021 (n=400,446) from GOV.UK Coronavirus dashboard, and the ONS 2020 mid-year population estimates.↩︎
Gov.UK. Healthcare admission rates by age in London. URL: https://coronavirus.data.gov.uk/details/healthcare?areaType=nhsRegion&areaName=London↩︎
Gov.UK. Coronavirus healthcare admission rates by age in England. URL: https://coronavirus.data.gov.uk/details/healthcare?areaType=nation&areaName=England↩︎
Kings College London. Black and Asian patients have increased risk of severe COVID-19 at different stages of the disease. URL: https://www.kcl.ac.uk/news/black-asian-patients-increased-risk-severe-covid-19↩︎
BAME-Black, Asian and Minority Ethnic group↩︎
Public Health England CHIME tool. Monthly age-standardised hospital admission rate per 100,000 person-years, for COVID-19 in England by ethnic group, March 2020 to May 2021. URL: https://analytics.phe.gov.uk/apps/chime/↩︎
There were 363 records with no ethnicity recorded.↩︎
The Independent SAGE Report 21: COVID-19 and Health Inequality. URL: https://www.independentsage.org/wp-content/uploads/2020/11/Inequalities-_i_SAGE_FINAL-draft_corrected.pdf↩︎
Rates were calculated using ONS Mid-2019 Annual small area population estimates.↩︎
Source: GOV.UK. Coronavirus in the UK. URL: https://coronavirus.data.gov.uk/details/cases?areaType=ltla&areaName=Wandsworth↩︎
Source: GOV.UK. Coronavirus in the UK. URL: https://coronavirus.data.gov.uk/details/cases?areaType=ltla&areaName=Wandsworth.↩︎
Local Government Association. Deprivation and Poverty- The Impact of COVID-19. URL: https://www.local.gov.uk/health-inequalities-deprivation-and-poverty-and-covid-19↩︎
Rate of deaths by deprivation is not age adjusted.↩︎
Lower Super Output Area (LSOA) is a geographic area that has an average population of 1500 people or 650 households.↩︎
Integrated Care System (ICS) is an advanced version of an STP. Organisations within an ICS (commissioners and providers) take collective responsibility, often in partnership with local authorities, for resources and population health. Sustainability and transformation partnership (STP) enables NHS organisations, local authorities and clinical commissioning groups (CCG) to work together to improve the health and wellbeing of a population of a particular area. CCGs commission most of the hospital and community NHS services in the local areas for which they are responsible.↩︎
ONS 2020 mid-year population estimates were used to calculate vaccine coverage.↩︎
Residents vaccinated with first dose are partially vaccinated and those who have received their second dose are fully vaccinated. Vaccine coverage is based on the number of residents aged 16+.↩︎
COVID-19 rapid guideline: managing the long-term effects of COVID-19 – NICE, RCGP and SIGN February 2022↩︎
ONS CIS Long COVID. URL: https://www.beta.ons.gov.uk/peoplepopulationandcommunity/healthandsocialcare/conditionsanddiseases/bulletins/prevalenceofongoingsymptomsfollowingcoronaviruscovid19infectionintheuk/6may2022↩︎
Health Needs Assessment of Post COVID-19 syndrome in London, OHID, Dr Nayab Nasir, December 2021↩︎
CLCH Equity of Access to Wandsworth and Merton Post COVID Services, Campbell Flack, May 2022.↩︎
For Wandsworth and Merton. Data source: NHS Central London Community Healthcare NHS Trust: Equity of access to the Wandsworth & Merton Post-COVID services, May 2021 – April 2022↩︎