JSNA People
1. Population
1.1 Key Points
Wandsworth is home to an estimated 334,103 residents 1, the second largest population in Inner London. Wandsworth is a large Inner London borough with a mobile, young, educated and economically active population. By 2034 the population is expected to increase to more than 342,00.
Since 2011 Census, Wandsworth population has increased by 6.7%. The previous increase between 2001 and 2011 was 17.9%. Since 2011, London’s population increased by 7.7%:
Borough population grew by 20,505 residents from 2011 to 2021
Wandsworth remained as the 8th largest borough in London; it is the 2nd largest borough in Inner London (after Newham).
The median age in the borough is 33 years. This is lower than London (35 years) and England (40 years).
Wandsworth is a popular place to live among young adults. Wandsworth currently has the 3rd highest percentage of 20-44 year olds in London (50%). Highest was Tower Hamlets (54.7%) then Islington.
The borough has got older overall with the largest relative increase seen in the 45-64 year age group 2.
Local population increase is currently driven by natural change (more birth than deaths) and in the next 10 years will be driven by large new housing developments such as Nine Elms
Of the projected population increase, 60% will take place in 4 wards–Queenstown, Fairfield, St. Mary’s Park and Thamesfield
The largest increase in numbers will be among those aged 20-39 years, driven by internal migration from other parts of UK moving into the borough, but the largest percentage increase will be in age groups 60 years and older with the population of those aged 85+ years growing by 42% by 2029
The BAME population will stay relatively similar at around 30%, and among children, BAME children will continue to make up almost 45% of the under 18 population.
The largest ethnic group in Wandsworth is White British. Almost 1 in 3 identify as Black, Asian, and Minority Ethnic (BAME), a lower proportion than the average for London and Inner London. The BAME population is younger with a higher proportion of children and fewer older people. Wandsworth children’s population is 45% BAME, compared to 30% BAME in the whole population.
The Wandsworth population is quite dynamic with a large proportion of people moving to and from London boroughs, other parts of UK, EU and beyond. During the last 10 years, 344,543 people moved into the Borough from within the UK. 360,038 moved out (net change of -15,495) and a further 66,801 international migrants moved out and 74,678 people moved in (net change of +7,877). During the same time-period there were 56,707 births and 17,010 deaths for net natural change of +39,697.
Over the past 10 years, population increase in Wandsworth was driven by the second highest rate of natural change (more births than deaths) in London and–to a lesser degree–net positive international migration. Over the next 10 years, net natural change will continue, with further contribution from migration from other parts of London and the UK into the new housing developments in the borough.
Overall, the international migration into Wandsworth has been decreasing. Non-UK born residents make up 31% of the population. The highest number of non-UK born population come from Poland (n=6,814), South Africa (n=6,468), Ireland (n=5,781), Australia (n=5,620), Pakistan (n=5,346) and India (n=4,137). In recent years, working-age international arrivals to Wandsworth have tended to be European with the highest number of national insurance numbers (NINos) registered to adult non-UK residents during 2018/19, were to Italians (n=1202), Spanish (n=667), Australians (n=643) and French (n=462).
As the population in Wandsworth is young most residents are not married or in civil partnerships, and compared to London, household sizes are smaller and fewer households have children. Almost 1 in 3 residents live alone. Of the almost 150,000 properties in Wandsworth, over two-thirds are flats, and almost a third of the households rent privately.
Fertility is dropping across UK and the developed world, and this trend is also reflected locally in recent years. About half the children born in Wandsworth are born to mothers born outside the UK.
Working-age adults in Wandsworth are among some of the most educated in the country, with almost two-thirds having achieved a degree or higher in their education. Wandsworth children perform similar or better to London children for in terms of educational attainment.
Wandsworth borough has one of the highest employment rates in London, at almost 80%, which is higher than London and England. Residents are much more likely to be managers, directors, professionals and in technical jobs (70.4%) compared to London (58.4%). This is because the area is a popular place of residence for those starting jobs in Westminster, the City and Canary Wharf.
Wandsworth remains within the least deprived second quartile of London local authorities, ranking 10th least deprived out of 33 boroughs in 2019, compared to 11th least deprived of 33 in 2015. Wandsworth does not have any areas that are among the 10% most deprived in the country. Wandsworth ranks amongst the least deprived boroughs in London for five of seven deprivation domains (Income; Employment; Education, Skills & Training; Barriers to Housing & Services and Crime) - it has a particularly high ranking for Education, Skills & Training.
In the Living Environment domain and the IDAOPI (Income Deprivation Affecting Older People Index) measure, Wandsworth was ranked among the most deprived boroughs in London. IDAOPI measures the proportion of all those aged 60 or over who experience income deprivation and it is a subset of the Income Deprivation Domain which measures the proportion of the population in an area experiencing deprivation relating to low income.
Wandsworth performs well compared to other London boroughs for most indicators, such as pay inequality, low pay, unemployment, and housing delivery. The poverty rate of 21.5% is below the London average (27.0%). Residents working full-time earned £34,168 in 2019; this was higher than the England average of £30,667 but lower than the London and inner London earnings of £38,992 and £42,667 respectively. In 2018, 0.9% of the borough’s residents were claiming income support which was lower than the London and national average. 3,844 households claimed universal credit with the majority being single adult households with no dependent children. Of those individuals claiming universal credit, 33%% were in employment and 67%% were not in employment. Wandsworth ranked 10th lowest borough in London for the proportion of residents claiming child benefit. However, the use of food banks, providing emergency food supplies, increased by 78% in the previous 5 years (between 2013/14 and 2018/19) with one-third of food being provided for children of primary school age. Wandsworth ranked 6th lowest borough in London for fuel poverty with 1 in 10 households experiencing poverty.
New-born males can expect to live up to 80.6 years and females, 84.2 years, an increase of 5.2 years and 2.7 years since 2001-03, respectively. Wandsworth residents are living longer than ever before but in recent years the rate of increase in life expectancy has decreased both locally and in England. Healthy life expectancy is 68.9 years and 65.8 among males and females respectively. In recent years, healthy life expectancy, that is life without serious illness, has decreased among females and increased among males. In Wandsworth and nationally, life expectancy is lower in areas of higher deprivation. Males in the least deprived areas of the borough live 5.5 years less and females 5.2 years less than those in more affluent areas.
Locally there were 1,666 premature deaths with circulatory, cancer and respiratory as leading causes. Premature deaths, that is deaths before 75 years, have dropped in Wandsworth over the past two decades but there is considerable room for improvement.
Most of the local population report leading happy and worthwhile lives, scoring better than the London average, but there is a subset of around one in five who reported low happiness, satisfaction, and high anxiety scores.
1.2 Population Size and Density
Wandsworth is home to an estimated 334,103 residents 3, the second largest population in Inner London. Wandsworth is a large Inner London borough with a mobile, young, educated and economically active population. By 2034 the population is expected to increase to 342,021. As shown in the figure below, the population percentage for all age groups below 20 years of age and above 45 years is smaller than expected from the London average. However, for ages 25 to 39 the proportion of Wandsworth residents is significantly higher than in London–this is particularly visible in females aged 25–34.
Population Pyramid
In Wandsworth in 2024, 100.0% (n=334,103) of the total population were 65 years old and over. The proportion of people aged 65+ in the borough is 0.0% higher than the London average of 100.0%.
Source: © GLA 2021-based demographic projections. Housing-led population projections. Past Delivery 10-year migration, 2023
In 2023, the borough’s population density was 10,164 per square kilometre, which was 1.7 times higher than the London average of 6,030 population per square kilometre: but lower than the inner London average of 11,953 population per square kilometre. The ward with the greatest population density was Graveney, 16,554 population per square kilometre, while the lowest was within the ward of Roehampton with a population density of 3,739 4.
1.3 Population Projections
The GLA population projections suggest that Wandsworth’s population will continue to grow but at a lower rate compared to other London Boroughs. Within 10 years’ time the population is predicted to increase by 2.3% from 334,103 in 2024 to 342,021 in 2034, compared with the projected population increase of 4.6% in London population by 2034.
- Wandsworth has the third highest natural change (birth minus deaths) in London
- The borough is home to large new housing developments such as Nine Elms and Ram Quarter in Fairfield
- Due to good transportation connections and large rental stock the borough is an attractive option for those moving to London to work in the City, Canary Wharf and Westminster.
As is the trend in England and London, the population in Wandsworth is getting older. As shown in (as shown in the figure below), over the next 10 years:
Children and Young People: 0–19 year olds are projected to decrease by 11% in the next decade (from 63,157 in 2024 to 56,020 in 2034), whilst the overall number of children and young people aged under 20 will reduce by 6% in London.
Young Adults: The 20–39 age group is expected to decrease of 3.1% (from 142,339 in 2024 to 148,688 in 2034). This decrease is in contrast to 2% increase in London.
Middle Age: A 3.7% decrease is projected for the 40–59 age group by 2034 (from 81,427 in 2024 to 78,515 in 2034), in comparison with 4% increase in London.
Source: © GLA 2021-based demographic projections. Housing-led population projections. Past Delivery 10-year migration, 2023
With respect to population increases at ward level (as shown in the figure below):
- The greatest projected population increase is expected in the ward of Queenstown, where the total population almost doubles by the year 2029 from 22,644 to 41,482. The biggest increase is seen in the 40–44-year-olds for this ward. This increase is driven by large property development in Nine Elms area
- Another ward with notably large increase in population is Fairfield with a 26% increase from 16,134 to 20,297, also driven by large property developments
- Roehampton, St. Mary’s Park, Thamesfield and Wandsworth Common are all projected to see increases of 13% between 2019 and 2029, a similar rate to the borough
- Off the 44,615 projected increase in population, 60% will happen in 4 wards; 42% will happen in Queenstown, 9.3% in Fairfield, 5.5% in St. Mary’s Park and 5% in Thamesfield.
Source: © GLA 2021-based demographic projections. Housing-led population projections. Past Delivery 10-year migration, 2023
Population projections in Wandsworth show an increasing trend for all ethnic groups (as shown in the figure below):
- Over the next 10 years, the highest percentage increases are expected in Arab, Other Mixed and White & Black African ethnic groups (all groups above 18%).
- The lowest growth is expected in Bangladeshi, Indian and Black Caribbean ethnic groups (all groups below 8% increase between 2023 and 2033).
Source: © GLA 2016-based Demographic Projections, 2017
1.4 Sex and Gender
In 2023 borough’s population is made up of 53% females (n=176,618) and 47% males (n=156,123). Female population is expected to increase by 4.8% by 2033. Male population is expected to decrease by 0.3% in the next 10 years 5.
The proportion of women and men are roughly equal across the life-course age-bands until later in life. As women experience longer life expectancy than men, by the time people are aged 75 years and over, one starts to see a shift in balance between the proportion of both genders (59% female, 41% male). There are estimated to be more females living alone in Wandsworth in 2023 than males and these numbers are projected to increase by 2033.
Sexual Orientation and Gender Identity
2021 Census has collected data on sexual orientation. The question was voluntary and only asked of people aged 16+ (n= 273.558):
- Locally, 14,148 (5.2%) of 16+ year olds were either gay/lesbian, bisexual or any other sexual orientation. This was lower than Inner London (6.4%) and higher than England (3.2%) and London (4.3%).
- Locally, males were more likely to identify as LGB+ with the majority aged between 25-44 years (higher proportion aged 24-34 years old). In females, the majority of LGB+ were more likely to be aged between 16-34 years (higher proportion aged 25-34 years old).
- England wide analyses show that majority of LGB+ were aged 16-34. In England, highest proportion was among those 16-24 years (6.91%) and the proportion was lower among older age groups.
- In England, among 16-24 years olds, bisexual was the most common identity. Gay and Lesbian was higher than bisexual among older age groups.
- In England, females were more likely to identify as LBG+. Among 16-24 year old almost double the proportion of females identified as LBG+ compered to males (9.38% vs. 4.5%) 6
- 254,037 (92.86% of residents aged 16+) said their gender identity was the same as their sex registered at birth, higher than London and England.
- In total, 1,691 (0.62%) Wandsworth residents indicated a change in gender identity with 713 (0.26%) stating their gender identity was different to that of birth but did not provide a write in response to what they identified with.
- Of the 1,690 residents who indicated a change in gender identity, there was an even split between males and females. 3 in 5 were aged under 44 years of age.
- Locally, 347 identified as trans woman and 304 identified as trans man; the proportions were lower to that of London but higher than England.
- 182 Wandsworth residents identified as non-binary. This proportion of the population was lower than the London but higher than England averages.
- In England, 16-24 were most likely age group to have said their gender identity was different from their sex registered at birth and proportion declined in older age groups.
1.5 Age Structure
The median age in the borough is 33 years. This is lower than London (35 years) and England (40 years).
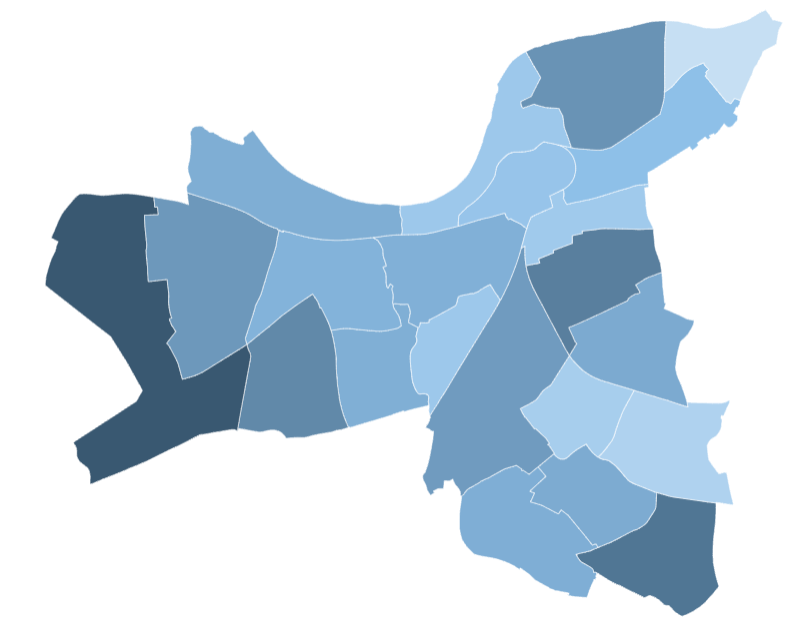
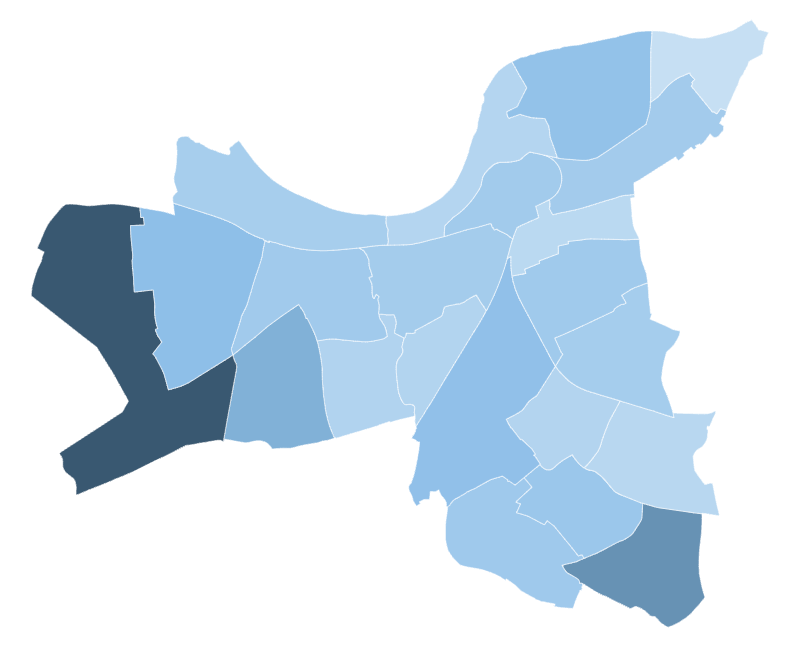
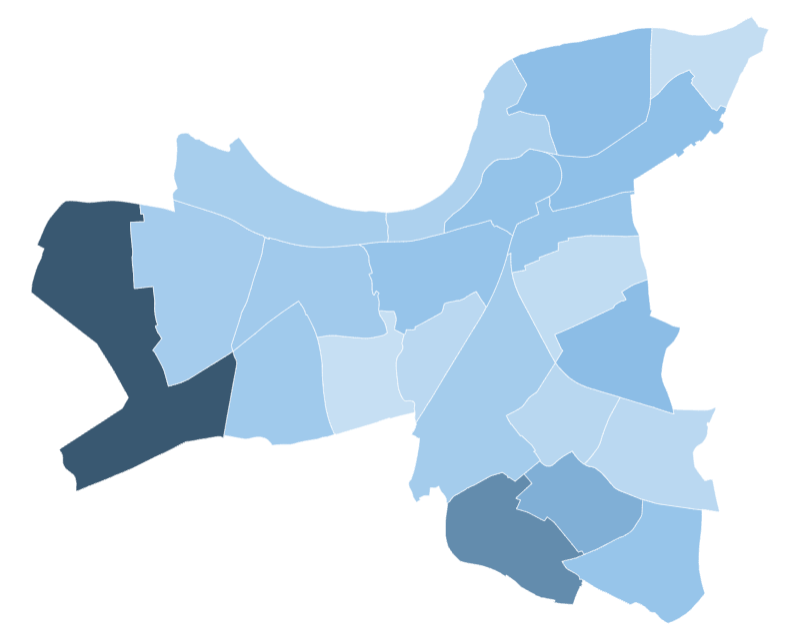
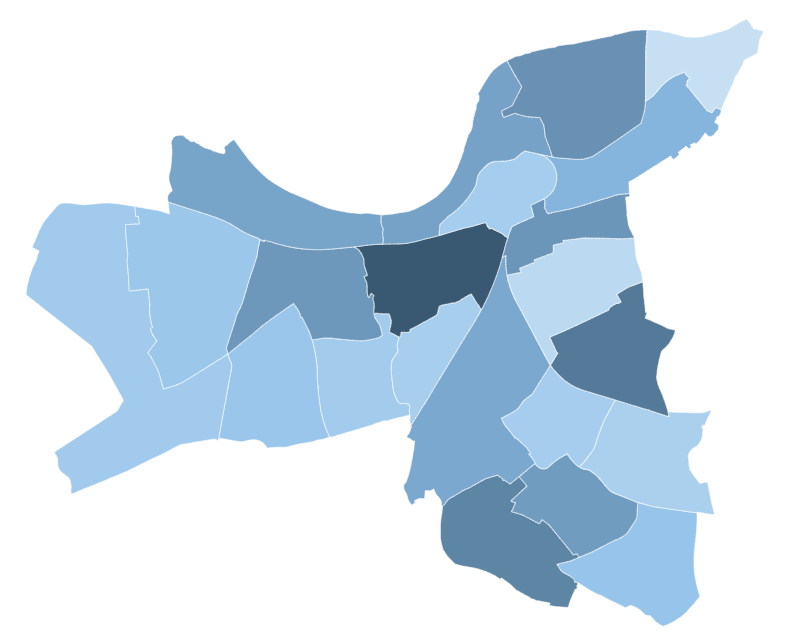
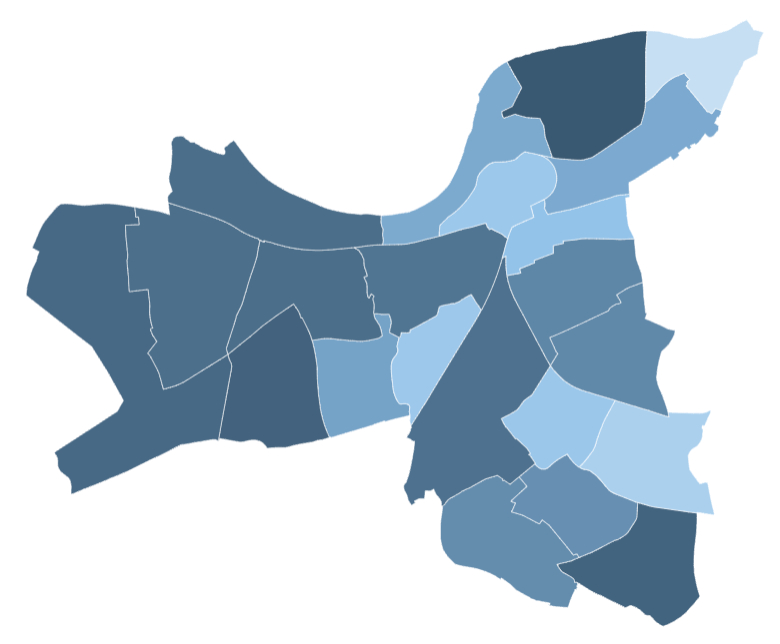
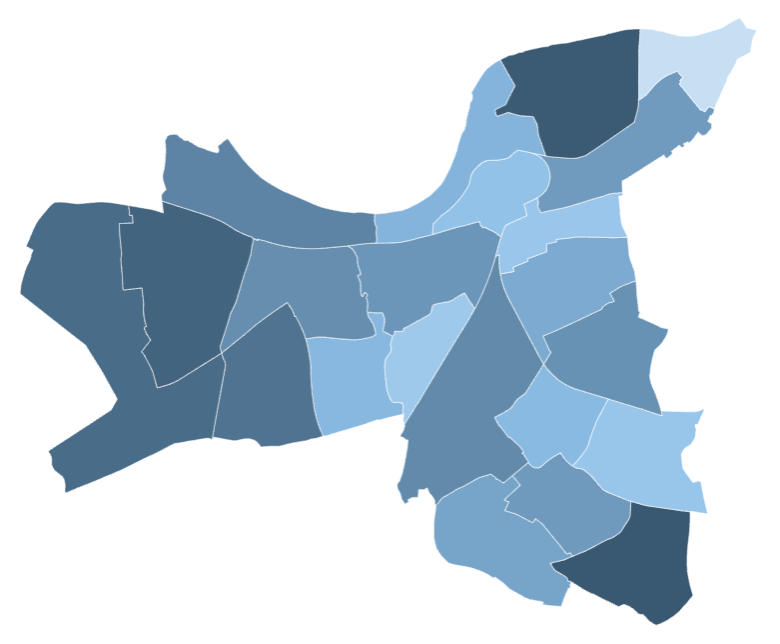
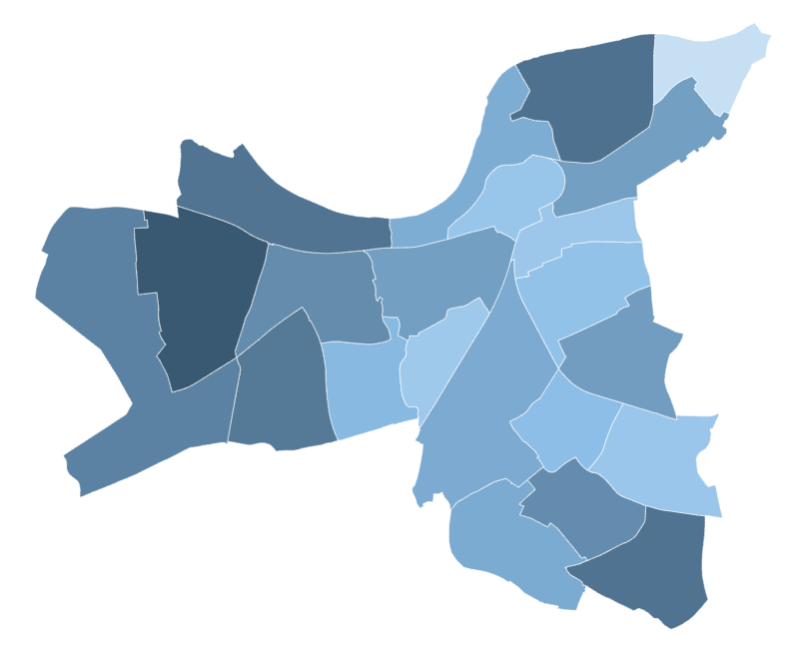
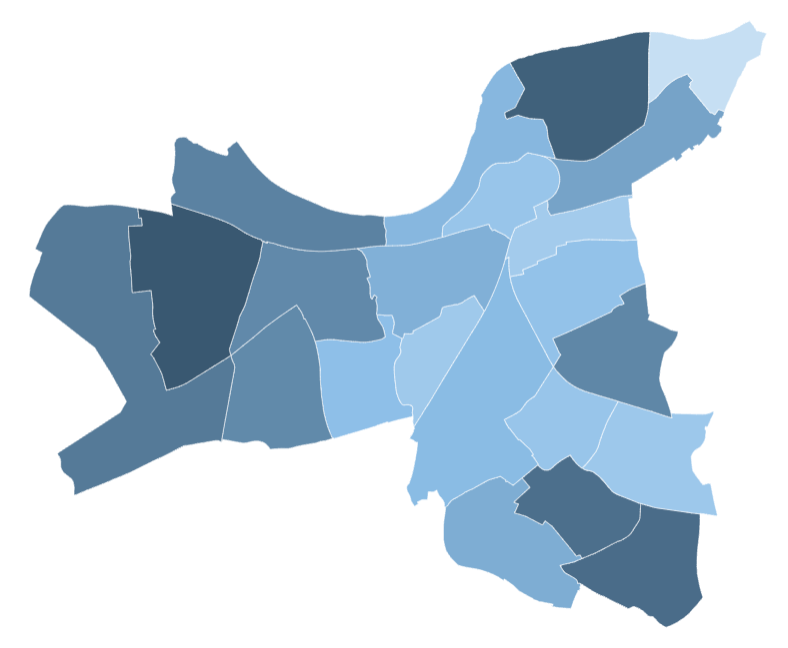
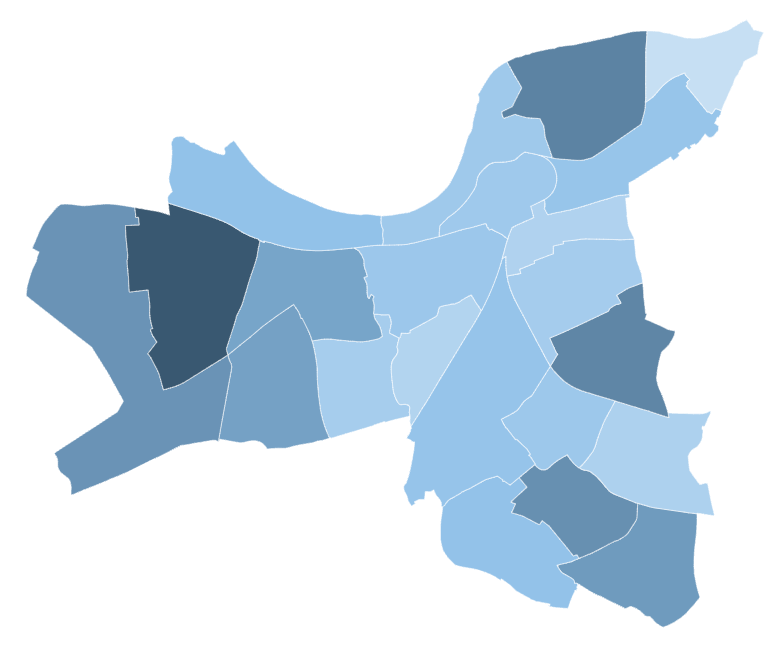
The maps below show the distribution of age groups across wards within the borough. 17% of Wandsworth’s population are under 14 years of age, with the greatest proportion found in the wards of Southfields and West Hill. Roehampton ward has the highest proportion of 15–19-year old’s and 20–24-year-olds.
Queenstown ward has the highest proportion of 25–39-year-olds as well as 40–49-year-olds. The wards with the greatest proportion of 50–64-year-olds are St Mary’s Park and Furzedown wards. St Mary’s Park also has the highest proportion of 65+ year olds.
| Age groups (years) | Heat map |
Under 14:
|
|
15-19 year-olds:
|
|
20-24 year-olds:
|
|
25-39 year-olds:
|
|
40-49 year-olds:
|
|
50-64 year-olds:
|
|
65-74 year-olds:
|
|
75-84 year-olds:
|
|
85+ year-olds:
|
|
Source: 2021 Census ONS Population Figures reported via DataWand Population Explorer.
Scale: Colour scale ranges from light (lower values) to dark (higher values).
1.6 Ethnicity
Detailed breakdown of ethnic groups by age, gender, ward and LSOA, and projections up to 2050 can be found on DataWand.
Wandsworth is an ethnically diverse Borough when compared to England, however, compared to London and Inner London, Wandsworth has much higher proportion of White British population.

In Wandsworth in 2023, 7 out of 10 residents were White (British, Irish, or other) (as shown on the figure and table below). 47% of the local population was White British, a much larger proportion than in London (38%). Around 30% of the residents were BAME, a lower proportion than Inner London and London. Major specific ethnic groups, other than White British, in Wandsworth are Black African, Black Caribbean and Pakistani.
In Wandsworth in 2024, 30.2% (n=106,791) of the total population were from BAME ethnic groups. The proportion of residents from BAME ethnic groups in the borough is 31.5% lower than the London average of 44.1%.
Source: © GLA 2016-based Demographic Projections, 2017
Source: 2021 Census ONS Population Figures reported via DataWand.
Age by Ethnicity
Three out of every ten residents in Wandsworth are from a black and minority ethnic background (BAME). The age profile of the BAME groups is younger than that of the White ethnic groups in the borough, with 30% aged 0–19 years. A greater proportion of the White population in Wandsworth is in the 20–44 age group (as shown in the figures below). This is likely due to young adults moving into Wandsworth from EU and other parts of UK. There was an almost equal proportion of 45–64-year-olds within both ethnic groups in the borough. The proportion of 65+ year olds in White ethnic group in 2017 was 10%, compared to 9% of people in the BAME being 65 or older.
Source: © GLA 2016-based Demographic Projections, 2017
Source: © GLA 2016-based Demographic Projections, 2017
BAME Population by Ward
The BAME population is higher in the South and North East of the borough (as shown on the map below). The BAME population account for more than half of the population in Falconbrook (at 52%), Roehampton (46%) and Tooting Broadway (44%). Northcote and Thamesfiled have the highest proportion of White ethnic groups (83% and 81% respectively). Detailed geographic breakdown at Ward level and lower can be found on DataWand.
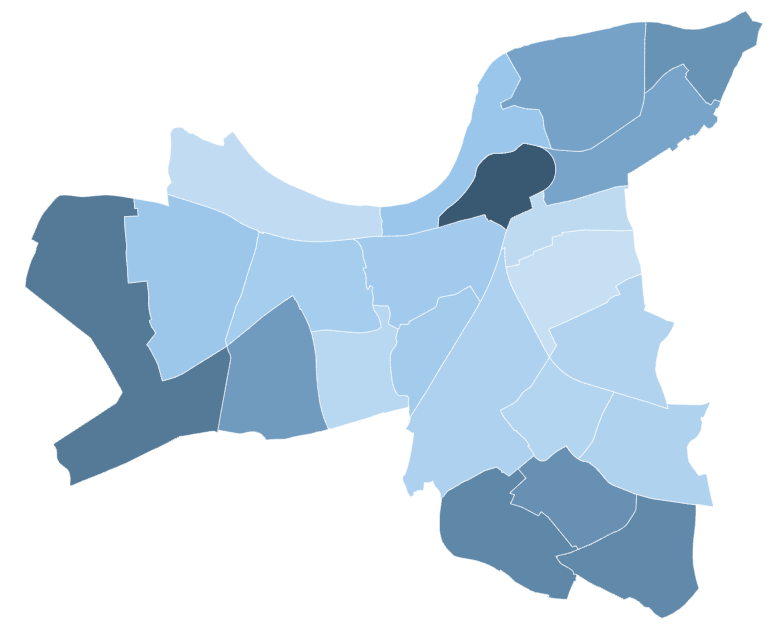
Source: Data Wand, Population Explorer
Scale: Colour scale ranges from light (lower values) to darker (higher values).
Gypsies and Travellers Population
At the last UK census (2021), 121 respondents in Wandsworth Borough reported their ethnicity as ‘Gypsy or Irish Traveller’, amounting to 0.1% of the Borough’s population. This matched the 2011 country-wide ‘Gypsy or Irish Traveller’ proportionate population (0.1%).
More than a third of Wandsworth’s Gypsies and Travellers live in Wandsworth Common (n=44).
1.7 Non-UK Born Population
Based on 2021 Census, 62% of Wandsworth’s population was born in the UK (n=203,322), compared with 59% in London.Compared to London, a smaller proportion of local population were born outside of Europe (22% in Wandsworth and 25% in London) (as shown in the table below).
The largest proportion of migrants to Wandsworth were born in Middle East and Asia (8.5% of the total population), followed by Africa (6.2%) and Amaricas and the Caribbean (5.6%). The higher ratio of recent to longer term migrations may be because Wandsworth has high population turnover and new arrivals may leave for other areas in UK or internationally, over time.
Source: 2021 Census ONS Population Figures reported via DataWand.
Language and English Proficiency
English is the main first language of the population of Wandsworth and English Proficiency is high 7. According to the 2021 Census:
• Vast majority of residents are proficient in English. 83% have English as their main language and further 15% can speak English well. • 7,325 residents cannot speak English well or at all (2.3%) an increase of 459 people since 2011 with the overall proportion remaining the same. Areas with the highest concentrations are around Roehampton South & Putney Vale (6.1%), Furzedown East (4.7%), Roehampton North (4.4%). • The proportion of people who cannot speak English well or at all is lower in Wandsworth (2.3%) than it is in Inner London (4.3%), London (4.2%), but higher than England (1.9%).
Source: 2021 Census ONS Population Figures reported via DataWand.
The linguistic picture is more diverse among school pupils 8., this is because under 18 population in the Borough is more ethnically diverse than the overall population. According to 2018 estimates:
- 45% of Wandsworth primary school pupils did not have English as their first language (Inner London=54%; London=49%), an increase from 41% in 2007.
- 44% of Wandsworth secondary school pupils did not have English as their first language (Inner London=49%; London=41%), an increase from 38% in 2007.
1.8 Religion
Religion and religious institutions continue to play a role in Wandsworth residents social, cultural, and spiritual lives.
The 2021 Census showed that:
• Less than half (45.3%) the borough is Christian. It is still the largest religion in Richmond, but has reduced by -10% points since 2011 (55.3%). This proportion is higher than Outer London (42.3%) and London (40.7%), but lower than England (46.3%). • One in three (37.9%) of the borough’s residents reported No Religion, an increase of 9.5% points since 2011. This proportion is higher than Outer London (24.1%), London (27.1%) and England (36.7%). • Islam is the second largest religion in the borough (4.3%) as it was in 2011 and the number of Muslim residents has increased by +38.6% since 2011. This is a similar increase to Outer London (38.2%), higher than London (+30.2%) and lower than England (+42.9%). • Of those residents reporting to be Christian, 29% were aged under 29 years, while 27% of Christians were 30-49 years. Residents reporting to be Muslim, there was a higher proportion of younger adults aged under 29 years (44%) compared to older adults aged 30-49 years (35%).
Detailed breakdown, based on 2021 Census, at Ward and LSOA level, age and gender can be found on DataWand; the overall Wandsworth’s figures can be found in the table below.
Source: 2021 Census ONS Population Figures reported via DataWand.
1.9 Marriage and Civil Partnership
Detailed breakdown, based on 2021 Census, at Ward and LSOA level, age and gender can be found on DataWand and in the table below. Marriage and civil partnership are described by reference to the legal definitions. It includes a person (or persons) who is (are) married or is (are) a civil partner (or civil partners).
In Wandsworth, according to 2021 Census, majority of residents were single (55.8%), unlike London (46.2%) and England (37.9%). This is likely due to younger age of the local population. Locally, around a third of the residents were married or in civil partnership (33%), which is lower than London (40%) and England (44.7%).
Source: 2021 Census ONS Population Figures reported via DataWand.
1.10 Conception and Birth Rate
Fertility is dropping across UK and in developed countries, and this trend is also reflected locally in recent years. The number of children born in Wandsworth is decreasing and is projected to decrease further. About half the children born in Wandsworth are born to mothers who were born outside the UK despite non-UK born residents only making up 31% of the population.
Source: ONS NOMIS.
In 2022, 1,904 of live births within the borough were to UK born mothers, whilst 1,907 were to non-UK born mothers, the majority being from the EU (21%), Middle East and Asia (12%) and the rest of the world (9%) which includes The Americas and the Caribbean and Antarctica and Oceania 9.
Most births, 73%, in 2017 took place to couples who were married or in civil partnership and 17% (n=789) of live births were to couples who had joint registrations at the same addresses (but were not married) 10. A joint registration records details of both parents and requires them to both be present and 7% (n=339) of live births in 2017 were to joint registrations but different addresses. Locally, 4% (n=170) of live births were registered sole parents (records only the mother’s details).
1.11 Household Composition
According to the 2021 Census, just under a third of the households were made up of one person living alone and almost another third were households with children (as shown in the tables below).
• In Wandsworth 41,132 (29.9%) are one person households i.e., people living alone. This is lower than Inner London (34.3%) and similar to London (29.3%) and England (30.1%). • 1 in 4 one person households (26%) are made up of a person who is 66+ years old. • The proportion of 66+ living alone (8%) has not changed since 2011 and is the same as Inner London, but lower than London (9%) and England (13%). • Older residents living alone (66+) are spread across the borough. One area of higher concentration is around Battersea Park
Source: 2021 Census ONS Population Figures reported via DataWand.
Source: 2021 Census ONS Population Figures reported via DataWand.
Source: 2021 Census ONS Population Figures reported via DataWand.
1.12 Self-reported Happiness, Satisfaction and Well-being
Most of the local population report leading happy and worthwhile lives, scoring better than the London average, but there is a subset of around one in five who reported low happiness, satisfaction, and high anxiety scores.
Self-reported well-being - high satisfaction score: % of respondents: In 2020/21, Wandsworth’s rate was 80.0%, which was the 3rd highest in London, 4.8% higher than the England average and 0.0% higher than the London average. The latest Borough figure for 2020/21 was also 3.7% higher than in 2011/12, in comparison with 0.6% increase in England’s rate in the equivalent time period.
Source: OHID: Public Health Profiles
Source: OHID: Public Health Profiles
Self-reported well-being - high happiness score: % of respondents: In 2020/21, Wandsworth’s rate was 64.1%, which was the 2nd lowest in London, 10.9% lower than the England average and 0.0% higher than the London average. The latest Borough figure for 2020/21 was also 8.6% lower than in 2011/12, in comparison with 1.2% increase in England’s rate in the equivalent time period.
Source: OHID: Public Health Profiles
Source: OHID: Public Health Profiles
Self reported wellbeing: people with a low happiness score: In 2022/23, Wandsworth’s rate was 5.9%, which was the 4th lowest in London, 33.2% lower than the England average and 35.3% lower than the London average. The latest Borough figure for 2022/23 was also 26.4% lower than in 2011/12, in comparison with 17.4% decrease in England’s rate in the equivalent time period.
Source: OHID: Public Health Profiles
Source: OHID: Public Health Profiles
Self reported wellbeing: people with a low satisfaction score: In 2022/23, Wandsworth’s rate was 3.8%, which was the 10th lowest in London, 32.6% lower than the England average and 34.9% lower than the London average. The latest Borough figure for 2022/23 was also 22.2% higher than in 2011/12, in comparison with 13.6% decrease in England’s rate in the equivalent time period.
Source: OHID: Public Health Profiles
Source: OHID: Public Health Profiles
Self reported wellbeing: people with a low worthwhile score: In 2022/23, Wandsworth’s rate was 5.1%, which was the 11th highest in London, 15.2% higher than the England average and 12.6% higher than the London average. The latest Borough figure for 2022/23 was also 77.4% higher than in 2011/12, in comparison with 7.1% decrease in England’s rate in the equivalent time period.
Source: OHID: Public Health Profiles
Source: OHID: Public Health Profiles
Along with Age UK, The Office for National Statistics has produced estimates of subjective loneliness for people aged 65 and over. Wandsworth ranks 13 of out 33 in London and 63 out of 326 in England (1 being the highest in terms of risk of loneliness in both cases) 11.
1.12 Voluntary Sector and Volunteering
Wandsworth Borough has an active and well-developed voluntary sector with over 900 voluntary sector organisations offering a diverse range of services. The sector is supported by the Council’s Voluntary Sector Partnership team, part of the Community and Partnership group, which works across both Wandsworth and Richmond.
The Voluntary Sector Coordinator Project supports voluntary organisations and community groups in Wandsworth to connect, collaborate and communicate both with each other, Wandsworth NHS Clinical Commissioning Group and Wandsworth Borough Council to work together in addressing health equality 12.
In Wandsworth, the percentage of people reporting volunteering dropped to 25% in (2013/14–2015/16) compared to 35% (2010/11–2012/13). In London the percentage has stayed steady around 25% in this time frame 13.
However, 2020, saw an increase in people coming forward to volunteer during Covid-19. Between March–November 2020, 3577 residents registered with the Council and supported over 11 voluntary and community organisations and supported a mentoring project led by Children Services and the Telephone Befriending Service led by the Enable Social Prescribing team. Wandsworth Care Alliance also set up a Volunteer Brokerage Scheme which these volunteers will be sign posted to and will be a mechanism for people to volunteer in the borough going forwards.
1.13 Population Change
Changes to population in Wandsworth, and beyond, are affected by two factors: * Natural change (births and deaths) * Migration which includes both internal migrations (moves in and out of the area from within the UK) and international migrations (movement of migrants to and from other countries).
Over the past 10 years, population increase was driven by Wandsworth having the second highest rate of natural change (more births than deaths) in London, and net positive international migration. Over the next 10 years, net natural increase is likely to continue, with further net increases in population attributable to migration from other parts of London and the UK into the new housing developments in the borough.
Natural Change
The natural change in population is made up of births minus deaths and was the largest component of increase. In 2021, there were 4,198 births and 1,653 deaths in Wandsworth 14. From 2008–2011 the number of births in Wandsworth steadily increased but have been declining since then. Over the past decade there have been 56,707 births and 17,010 deaths, producing an overall increase of +39,697.
Migration
International migration: In 2021, there was a greater inflow of international migrants than outflow (an overall increase of 14). However, in the previous year the number of International migrants leaving was smaller than the number arriving, producing an overall net increase. The effects of international migration on Wandsworth’s population growth has been decreasing.
Internal Migration: Residential moves between different local authorities) with a net change of +49 in 2021. Apart from 2009 and 2017, net internal migration has had a downward trend where the number decreases year on year. In 2021, the number of internal migrations into Wandsworth was 9,989, and the number of outflows was 9,940.
Other Causes of Population Change
The population change describes the estimated net effect of changes to special populations during the twelve months to mid-year. Special populations comprise prisoner, armed forces, and their overseas based dependent populations. This includes estimated population change not attributed to a specific cause in the twelve months to mid-year and small adjustments necessary to account for issues such as minor LA boundary changes and large postcode areas that overlap LA boundaries. These cases account for a change of +2,955 from 2008–2018. The figure below shows the main directions of migration in and out of Wandsworth (as of 2018).

Source: ONS Internal migration: Matrices of moves between local authorities and regions, June 2018.
New Arrivals GP Registration
Wandsworth’s GP registrations data shows the number of new international migrants registering with a GP by looking at those added to the patient register in the previous year with a ‘Flag 4’ status which indicates that they previously lived overseas. In 2018, there were 8,950 new GP registrations locally for individuals whose previous address was outside UK, lower than 2014–2017 when registration averaged around 9,500 per year. New registrations are not an ideal indicator of migration but are useful in terms of planning GP services. Because a GP registration is not compulsory, some people will only register with a GP if they require medical attention. Thus, there may be a gap between the actual migration event and the GP registration. The borough ranked 12 out of 33 in terms of highest GP registrations 15.
Please note people can register with a GP that is not in their own Borough and these registrations also include British nationals living outside the UK for more than three months.
National Insurance Numbers Issued to Overseas Nationals
National insurance number registrations indicate the nationality of adult international migrant into Wandsworth. In the year to June 2019, the number of national insurance number (NINos) allocations to adult overseas nationals entering Wandsworth was 8,669, which was a 14% increase from the year to June 2018 figure of 7,624. Of the NINos allocated, 61% were allocated to EU nationals, 4% to other European nationals, 9% to Asian individuals, and 25% to the rest of the world. This indicates that working-age migrants now are even more likely to be EU nationals. The decline in Wandsworth is like Inner London and London.
During the financial year 2018/19, there were 7,857 NINos registered to overseas nationals, the lowest number in last 12 years. Since 2008/09, there has been a 30% decrease in the number of NINos allocated in Wandsworth 16. The highest number of NINos registered to adult non-UK nationals in Wandsworth, during 2018/19, were to Italians 15% (n=1202), 8% Spanish (n=667), 8% Australians (n=643) and 6% French (n=462) 17.
2 Life Expectancy and Healthy Life Expectancy
2.1 Life Expectancy
In general, people in Wandsworth live longer than the national average; however, life expectancy at birth and at 65 years of age tend to be higher in other London boroughs. Females in the borough live 3.6 years longer than males, but a recent decline in healthy life expectancy in women sees them spending longer in poor health than previously and spending longer in poor health than men.
Variations in life expectancy across the borough are driven by inequalities between more deprived and less deprived areas. These are most evident in the 60 to 79 age group and are mainly driven by cancer and cardiovascular disease.
Wandsworth performs similarly to the national and regional averages for nearly all causes of premature mortality in men and women, but rates are still higher amongst males in the borough compared to females. Incidentally, the proportion of people screened for conditions such as cancer in the borough is low compared to the national average, but those undergoing NHS Health Checks was better than the national average.
Life Expectancy at Birth
Life expectancy at birth provides information on the estimated length of life a newborn baby would survive if he/she experienced the age-specific mortality rates for that area and time throughout his/her life.
Males
Life expectancy at birth: In 2020 - 22, Wandsworth’s rate was 79.8 years, which was the 8th highest in London, 1.2% higher than the England average and 0.8% higher than the London average. The latest Borough figure for 2020 - 22 was also 5.6% higher than in 2001 - 03, in comparison with 3.5% increase in England’s rate in the equivalent time period.
Source: OHID: Public Health Profiles
Source: OHID: Public Health Profiles
Females
Life expectancy at birth: In 2020 - 22, Wandsworth’s rate was 84.2 years, which was the 11th highest in London, 1.6% higher than the England average and 0.6% higher than the London average. The latest Borough figure for 2020 - 22 was also 4.9% higher than in 2001 - 03, in comparison with 2.6% increase in England’s rate in the equivalent time period.
Source: OHID: Public Health Profiles
Source: OHID: Public Health Profiles
Life expectancy at 65
Life expectancy at 65 is an estimate of the average number of years at age 65 a person would survive if he or she experienced the age-specific mortality rates for that area and time throughout his or her life after that age.
Males
Life expectancy at 65: In 2020 - 22, Wandsworth’s rate was 18.3 years, which was the 15th highest in London, 0.4% lower than the England average and 0.1% higher than the London average. The latest Borough figure for 2020 - 22 was also 16.0% higher than in 2001 - 03, in comparison with 12.9% increase in England’s rate in the equivalent time period.
Source: OHID: Public Health Profiles
Source: OHID: Public Health Profiles
Females
Life expectancy at 65: In 2020 - 22, Wandsworth’s rate was 21.6 years, which was the 13th highest in London, 3.2% higher than the England average and 1.2% higher than the London average. The latest Borough figure for 2020 - 22 was also 13.6% higher than in 2001 - 03, in comparison with 8.7% increase in England’s rate in the equivalent time period.
Source: OHID: Public Health Profiles
Source: OHID: Public Health Profiles
2.2 Healthy Life Expectancy
Healthy life expectancy is the number of years that a person is expected to continue to live in a healthy condition free of disability or poor health.
Healthy life expectancy at birth
Males
Healthy life expectancy at birth: In 2018 - 20, Wandsworth’s rate was 65.4 years, which was the 10th highest in London, 3.6% higher than the England average and 2.6% higher than the London average. The latest Borough figure for 2018 - 20 was also 4.5% higher than in 2009 - 11, in comparison with 0.2% increase in England’s rate in the equivalent time period.
Source: OHID: Public Health Profiles
Source: OHID: Public Health Profiles
Females
Healthy life expectancy at birth: In 2018 - 20, Wandsworth’s rate was 70.1 years, which was the highest in London, 9.8% higher than the England average and 8.0% higher than the London average. The latest Borough figure for 2018 - 20 was also 7.5% higher than in 2009 - 11, in comparison with 0.3% decrease in England’s rate in the equivalent time period.
Source: OHID: Public Health Profiles
Source: OHID: Public Health Profiles
Healthy life expectancy at 65
Males
Healthy life expectancy at 65: In 2018 - 20, Wandsworth’s rate was 10.3 years, which was the 16th lowest in London, 1.6% lower than the England average and 0.3% higher than the London average. The latest Borough figure for 2018 - 20 was also 5.2% lower than in 2009 - 11, in comparison with 5.8% increase in England’s rate in the equivalent time period.
Source: OHID: Public Health Profiles
Source: OHID: Public Health Profiles
Females
Healthy life expectancy at 65: In 2018 - 20, Wandsworth’s rate was 14.3 years, which was the 2nd highest in London, 26.2% higher than the England average and 28.3% higher than the London average. The latest Borough figure for 2018 - 20 was also 2.1% higher than in 2009 - 11, in comparison with 6.6% increase in England’s rate in the equivalent time period.
Source: OHID: Public Health Profiles
Source: OHID: Public Health Profiles
The table below presents latest life expectancy indicators for Wandsworth, London and England. Wandsworth’s values are higher than the London average for male healthy life expectancy at birth and healthy life expectancy at 65 for males and females. For all other indicators Wandsworth’s figures are below the London average.
Source OHID Public Health Profiles. Life Expectancy Indicators, 2018-20.
As shown in the figure below, male life expectancy at birth has steadily increased by 1.8 years between 2009–11 (78.8 years) and 2017–19 (80.6 years); the latest 2018-20 figure has dropped to 80 years.
Male healthy life expectancy at birth has fluctuated yearly from 2009-11 (62.7 years) to 2017-19 (65.4 years). Male healthy life expectancy at birth was the highest in 2016-18 (68.9 years) but was lower in 2017-19 (62.7 years) and 2018-20 (65.4). in 2018-20, 14.4 of male years of life were lived in poor health; the lowest value in the past decade.
Female life expectancy at birth increased by 1.3 years between 2009–11 (83 years) and 2018-20 (84.3 years). This may be explained by healthcare advancements. Female healthy life expectancy at birth increased by 2.9 years between 2009–11 (65.2 years) and 2018-20 (70.1 years). There has been a decrease in the number of years of life lived in poor health for females - the figure for 2018-20 (14.4) was the lowest in the past decade.
Source OHID Public Health Profiles. Life Expectancy Indicators, 2018-20.
2.3 Inequalities in Life Expectancy
Males
Inequality in life expectancy at birth: In 2018 - 20, Wandsworth’s rate was 5.9 years, which was the 7th lowest in London, 39.2% lower than the England average and 21.3% lower than the London average. The latest Borough figure for 2018 - 20 was also 26.2% lower than in 2010 - 12, in comparison with 6.6% increase in England’s rate in the equivalent time period.
Source: OHID: Public Health Profiles
Source: OHID: Public Health Profiles
Females
Inequality in life expectancy at birth: In 2018 - 20, Wandsworth’s rate was 5.8 years, which was the 14th highest in London, 26.6% lower than the England average and 7.4% higher than the London average. The latest Borough figure for 2018 - 20 was also 0.0% higher than in 2010 - 12, in comparison with 16.2% increase in England’s rate in the equivalent time period.
Source: OHID: Public Health Profiles
Source: OHID: Public Health Profiles
OHID Segment Tool provides information on the causes of death and age groups that are driving inequalities in life expectancy locally. If the causes of death that contribute most to the gap in life expectancy are targeted, then inequalities should be reduced. The two figures below show contributions to the local life expectancy gap in years and as a proportion of the overall gap.
Source: OHID Segment Tool
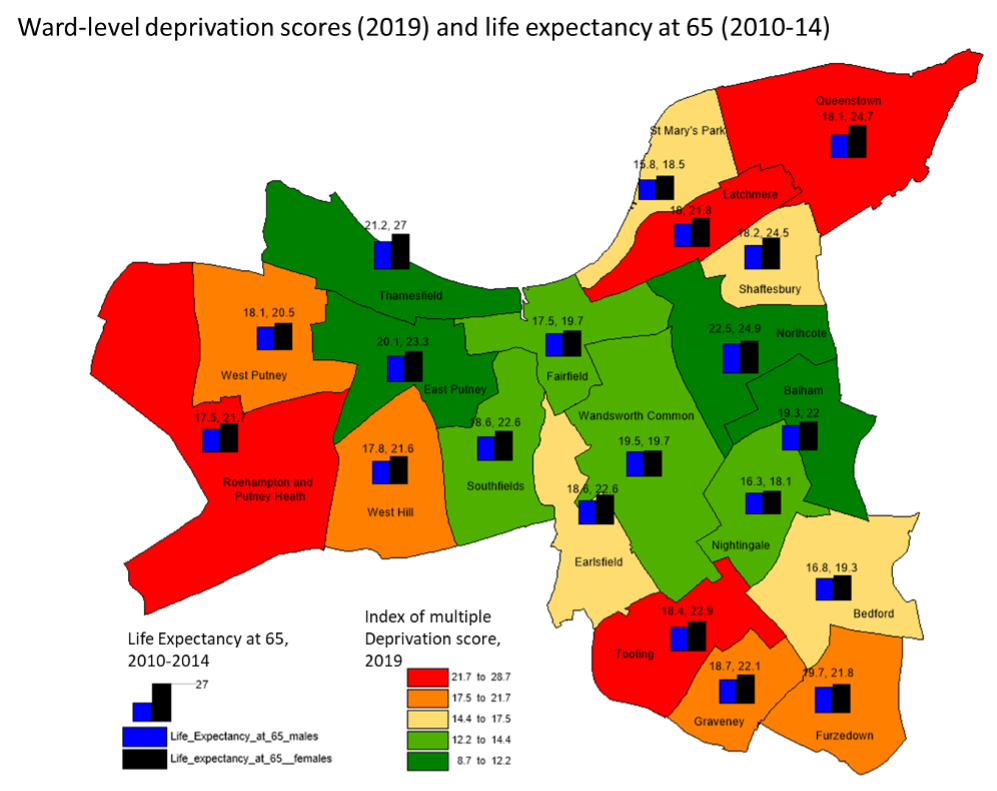
2.4 Ward-level Life Expectancy and Deprivation
The figure below shows Ward-level IMD 2019 average scores that were used to create Ward-level deprivation quintiles (each consisting of 4 Wards). Latchmere and Roehampton and Putney Heath are the two most deprived Wards in Wandsworth; both with the IMD 2019 average score higher than 25. This is in stark contrast to four least deprived Wandsworth’s Wards that have IMD 2019 average scores below 12 (East Putney, Balham, Thamesfield and Northcote).
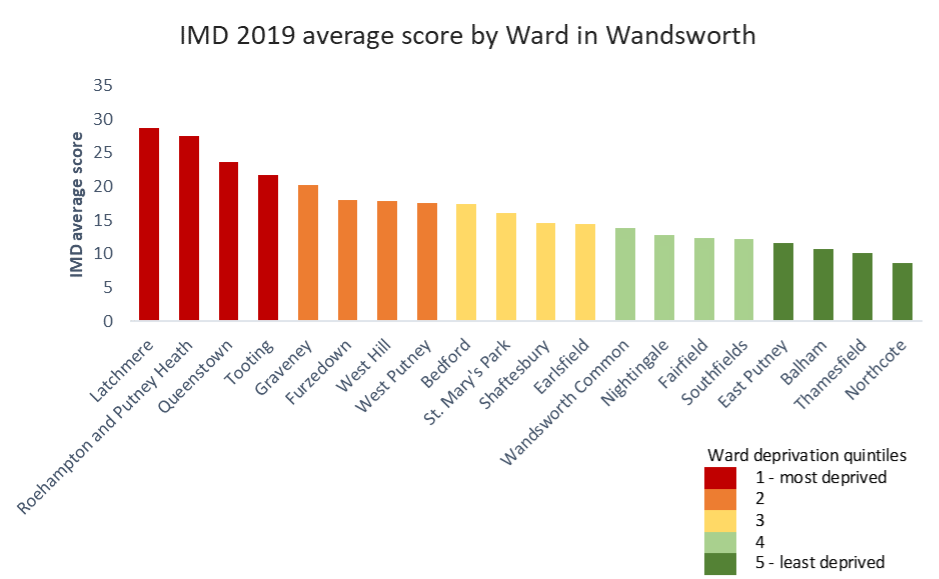
Source: London Datastore: London Wards Indices of Deprivation
Ward-level Life Expectancy at Birth
The latest (2010–14) Ward-level life expectancy at birth and percentage increases in life expectancy since baseline of 2002–06, as shown in the figure below. Life expectancy was the highest in four least deprived Wards (also shown below). The Wards from the most deprived quintile had either average life expectancy (Queenstown and Tooting) or low life expectancy (Latchmere and Roehampton).
Bedford was the only Ward with less than 1% increase in life expectancy from baseline (0.6%: from 80.0 in 2002–06 to 80.6 in 2010–14). The highest gains in life expectancy of over 6% were recorded in Northcote and Latchmere.

Source: London Datastore: Life Expectancy at Birth and Age 65 by Ward and London Wards Indices of Deprivation

Source: London Datastore: Life Expectancy at Birth and Age 65 by Ward and London Wards Indices of Deprivation
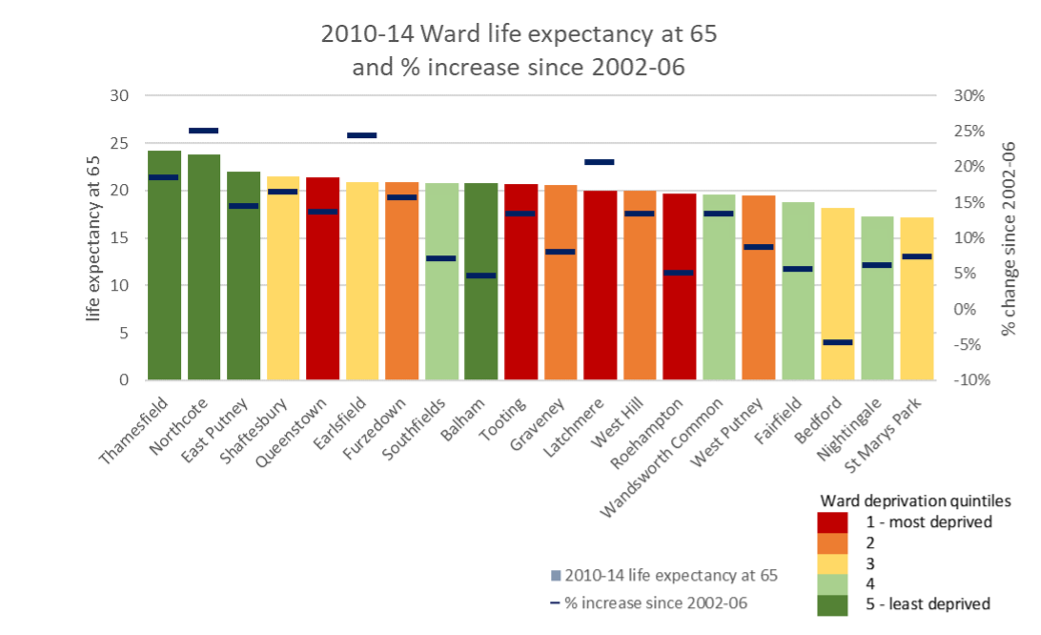
Ward-level Life Expectancy at 65
The latest (2010–14) Ward-level life expectancy at 65 and percentage increases in life expectancy since baseline of 2002–06 (as shown in the two figures below). Life expectancy at 65 was the highest in four wards in the least deprived quintile, the same Wards that had the highest life expectancy at birth. The relationship between deprivation and life expectancy at 65 in other deprivation quintiles is less clear, with the most deprived wards having either average or low life expectancy at 65. There was a substantial variation in relative gains in life expectancy at 65 at a Ward-level. Bedford was the only Ward with decrease in life expectancy at 65 between 2002–06 and 2010–14 (4.6% reduction in LE at 65). The highest gains in life expectancy at 65 of over 20% were recorded in Northcote, Earlsfield and Latchmere.
Source: London Datastore: Life Expectancy at Birth and Age 65 by Ward and London Wards Indices of Deprivation
Source: London Datastore: Life Expectancy at Birth and Age 65 by Ward and London Wards Indices of Deprivation
3. Mortality
3.1 Leading Causes of Deaths
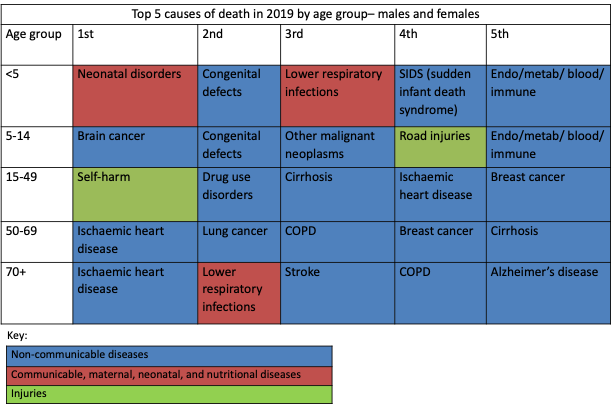
The figure below expresses the leading causes of deaths in the borough by age band in 2019. Overall, the mortality is skewed towards older ages. Top causes are ischaemic heart disease, Alzheimer’s, lung cancer, COPD, and lower respiratory infections. Injuries, including self-harm are a major cause of death among those under 40 and heart disease is the main cause of premature mortality (deaths before 75).
3.2 Premature Mortality (Under 75 mortality)
Males and Females - Under 75 All Cause Mortality
Under 75 mortality rate from all causes: In 2020 - 22, Wandsworth’s rate was 315.7 per 100,000 (n=1801), which was the 11th lowest in London, 11.1% lower than the England average and 8.2% lower than the London average. The latest Borough figure for 2020 - 22 was also 37.2% lower than in 2001 - 03, in comparison with 21.4% decrease in England’s rate in the equivalent time period.
Source: OHID: Public Health Profiles
Source: OHID: Public Health Profiles
Males - Under 75 All Cause Mortality
Under 75 mortality rate from all causes: In 2020 - 22, Wandsworth’s rate was 405.2 per 100,000 (n=1086), which was the 11th lowest in London, 7.4% lower than the England average and 7.8% lower than the London average. The latest Borough figure for 2020 - 22 was also 36.5% lower than in 2001 - 03, in comparison with 22.5% decrease in England’s rate in the equivalent time period.
Source: OHID: Public Health Profiles
Source: OHID: Public Health Profiles
Females - Under 75 All Cause Mortality
Under 75 mortality rate from all causes: In 2020 - 22, Wandsworth’s rate was 237.4 per 100,000 (n=715), which was the 11th lowest in London, 14.4% lower than the England average and 7.3% lower than the London average. The latest Borough figure for 2020 - 22 was also 37.8% lower than in 2001 - 03, in comparison with 20.4% decrease in England’s rate in the equivalent time period.
Source: OHID: Public Health Profiles
Source: OHID: Public Health Profiles
People with serious mental health illness, such as bipolar and schizophrenia, are at an increased risk of premature mortality. In Wandsworth, the extent to which adults with a serious mental illness die prematurely compared to adults in the general population is 322% higher. Nationally, most of these deaths are due to cardiovascular disease and cancer. These findings in part reflect the higher rates of smoking, alcohol use and substance use among those with serious mental health illness 18.
Under 75 Cardiovascular Deaths
Under 75 mortality rate from all circulatory diseases: In 2020 - 22, Wandsworth’s rate was 61.1 per 100,000 (n=327), which was the 7th lowest in London, 19.6% lower than the England average and 18.1% lower than the London average. The latest Borough figure for 2020 - 22 was also 60.7% lower than in 2001 - 03, in comparison with 44.9% decrease in England’s rate in the equivalent time period.
Source: OHID: Public Health Profiles
Source: OHID: Public Health Profiles
Under 75 Cancer Deaths
Under 75 mortality rate from cancer: In 2020 - 22, Wandsworth’s rate was 105.2 per 100,000 (n=585), which was the 12th lowest in London, 14.7% lower than the England average and 5.6% lower than the London average. The latest Borough figure for 2020 - 22 was also 37.2% lower than in 2001 - 03, in comparison with 27.3% decrease in England’s rate in the equivalent time period.
Source: OHID: Public Health Profiles
Source: OHID: Public Health Profiles
Under 75 Respiratory Deaths
Under 75 mortality rate from respiratory disease: In 2020 - 22, Wandsworth’s rate was 21.6 per 100,000 (n=108), which was the 9th lowest in London, 25.3% lower than the England average and 15.0% lower than the London average. The latest Borough figure for 2020 - 22 was also 54.1% lower than in 2001 - 03, in comparison with 27.5% decrease in England’s rate in the equivalent time period.
Source: OHID: Public Health Profiles
Source: OHID: Public Health Profiles
3.3 Preventable Mortality
Preventable mortality describes causes of death which are considered preventable. These are causes where all or most deaths could potentially be prevented by public health interventions in the broadest sense.
In 2021 the highest number of preventable deaths in Wandsworth were due to cancer (n=72), cardiovascular diseases (n=40), liver disease (n=36) and respiratory conditions (n=19) All these conditions are affected by health behaviours, such as smoking. For all disease categories, preventable mortality in males almost doubles the rate of mortality in females; this inequality is especially visible in preventable cardiovascular mortality where men’s rate almost triples women’s rate 44.8/100,000 population vs. 17.4/100,000 population (Table 12). For all cardiovascular and cancer preventable mortality indicators, Wandsworth’s rates are higher than England’s–except of female preventable mortality from cancer.
Source: OHID: Public Health Profiles
Preventable Mortality from All Causes
Under 75 mortality rate from causes considered preventable: In 2020 - 22, Wandsworth’s rate was 152.1 per 100,000 (n=874), which was the 10th lowest in London, 11.3% lower than the England average and 10.2% lower than the London average. The latest Borough figure for 2020 - 22 was also 28.5% lower than in 2001 - 03, in comparison with 10.9% decrease in England’s rate in the equivalent time period.
Source: OHID: Public Health Profiles
Source: OHID: Public Health Profiles
Preventable Cardiovascular Deaths
Under 75 mortality rate from circulatory diseases considered preventable: In 2020 - 22, Wandsworth’s rate was 23.6 per 100,000 (n=124), which was the 5th lowest in London, 21.7% lower than the England average and 20.7% lower than the London average. The latest Borough figure for 2020 - 22 was also 64.0% lower than in 2001 - 03, in comparison with 50.5% decrease in England’s rate in the equivalent time period.
Source: OHID: Public Health Profiles
Source: OHID: Public Health Profiles
Preventable Cancer Deaths
Under 75 mortality rate from cancer considered preventable: In 2020 - 22, Wandsworth’s rate was 43.0 per 100,000 (n=233), which was the 15th lowest in London, 14.8% lower than the England average and 2.6% lower than the London average. The latest Borough figure for 2020 - 22 was also 39.5% lower than in 2001 - 03, in comparison with 27.5% decrease in England’s rate in the equivalent time period.
Source: OHID: Public Health Profiles
Source: OHID: Public Health Profiles
Preventable Liver Disease Deaths
Under 75 mortality rate from liver disease considered preventable: In 2020 - 22, Wandsworth’s rate was 17.2 per 100,000 (n=101), which was the 14th highest in London, 8.1% lower than the England average and 4.9% higher than the London average. The latest Borough figure for 2020 - 22 was also 21.3% lower than in 2001 - 03, in comparison with 33.1% increase in England’s rate in the equivalent time period.
Source: OHID: Public Health Profiles
Source: OHID: Public Health Profiles
Preventable Respiratory Disease Deaths
Under 75 mortality rate from respiratory disease considered preventable: In 2020 - 22, Wandsworth’s rate was 13.0 per 100,000 (n=63), which was the 14th lowest in London, 23.4% lower than the England average and 9.1% lower than the London average. The latest Borough figure for 2020 - 22 was also 42.4% lower than in 2001 - 03, in comparison with 20.1% decrease in England’s rate in the equivalent time period.
Source: OHID: Public Health Profiles
Source: OHID: Public Health Profiles
3.4 Other Causes of Death
Fraction of Mortality Attributable to Particulate Air Pollution
Fraction of mortality attributable to particulate air pollution (new method): In 2022, Wandsworth’s rate was 7.2%, which was the 16th highest in London, 23.1% higher than the England average and 0.4% higher than the London average. The latest Borough figure for 2022 was also 21.2% lower than in 2018, in comparison with 17.7% decrease in England’s rate in the equivalent time period.
Source: OHID: Public Health Profiles
Source: OHID: Public Health Profiles
Mortality from Communicable Diseases, including Influenza
Mortality rate from a range of specified communicable diseases, including influenza: In 2020 - 22, Wandsworth’s rate was 9.6 per 100,000 (n=53), which was the 12th lowest in London, 7.2% lower than the England average and 7.6% lower than the London average. The latest Borough figure for 2020 - 22 was also 45.5% lower than in 2001 - 03, in comparison with 12.4% increase in England’s rate in the equivalent time period.
Source: OHID: Public Health Profiles
Source: OHID: Public Health Profiles
4. Education and Employment
Many Wandsworth pupils attend independent schools, the borough has the fifth largest independent school cohort in inner London and the sixth largest in London. Despite this, local primary and secondary pupils are more likely to attend state-funded schools in other local authorities.
Wandsworth achieved above than the London and England averages for key stage 2 pupils meeting the expected standard in writing, reading and maths: key stage 4 attainment 8 score as well as GCSE students achieving grade 5 or above in English and maths. While the borough performs lower than England in proportion of A-level students achieving at least AAB grades and in rate of pupils’ absences.
High educational attainment is evident amongst adults in the borough with nearly 2 out of every 3 of the working-age population possessing a degree or higher-level qualification.
The local trend shows that the proportion of pupils with special educational needs in Wandsworth schools has been declining but the borough remains higher than the London and national rates.
4.1 Education in Children
In 2019, 116 schools provided education to approximately 45,000 pupils within the borough of Wandsworth. Of these pupils, 46% attended state funded primary schools, 28% attended state funded secondary schools and 23% attended independent schools.
In 2022/23, the number of pupils attending Wandsworth schools with special educational needs (SEN) was 6,004 (13.9%). This was higher than the London (12.1%) and England (13.0%) 19. Wandsworth has remained higher than the London and England rates since 2014 (as shown in the figures below).
Pupils with special educational needs (SEN): % of school pupils with special educational needs: In 2022/23, Wandsworth’s rate was 19.7% (n=8543), which was the 4th highest in London, 13.9% higher than the England average and 18.7% higher than the London average. The latest Borough figure for 2022/23 was also 13.9% higher than in 2015/16, in comparison with 20.1% increase in England’s rate in the equivalent time period.
Source: OHID: Public Health Profiles
Source: OHID: Public Health Profiles
More details on education, educational attainment of school-aged children as well as on special educational needs (SEN) can be found in Start Well section.
4.2 Educational Attainment in Adults
The proportion of Wandsworth’s population achieving degree or equivalent is much higher than the England average. 66.5% of residents have degree education or above, almost double the England level of 36.8% (as shown in the below below). This higher level of educational attainment explains higher levels of income and employment in the borough and why almost 70% of the population work as managers, directors and in professional occupations. The percentage of the local population that have no qualifications has dropped from 7.7% in 2004 to 1.4% in 2021.
Source: DataWand
4.3 Employment and Economic Activity
In 2022 inn Wandsworth, 89.2% of those aged 16 to 64 were in employment. This was above both the London (76.2%) and England (75.8%) employment rates 20.
Proportionally, the employment and economic activity rates are lower amongst females in the borough compared to males - this pattern is observed nationwide.
Source: DataWand
Wandsworth residents are much more likely to be in managerial, professional, and technical occupations (70.7%) compared to England (50.0%). There is a lower proportion of Wandsworth residents carrying out administrative, secretarial, and skilled trade occupations compared to the London and England averages. Less than 5% are employed in elementary occupations 21.
Local residents are more likely to be full-time, salaried, and work in the private sector. It is also more common for residents to work over 35 hours, with 44% working 35-44 hours and 39% working over 45 hours. Residents in Wandsworth are more likely to be working more than 45 hours per week (34%) in comparison with a London average of; this could be due to longer hours at managerial and professional jobs - also more common in Wandsworth than in London and England 22.
ONS analysis found that 7.4% of jobs in England are at high risk of automation i.e., replacing tasks currently done by workers with technology which could include computer programs, algorithms or even robots. The risk of automation tends to be higher for lower skilled roles and the three occupations with the highest probability of automation are waiters and waitresses, shelf fillers and elementary sales occupations 23. Wandsworth has 5.7% of its population in elementary occupations, and 4.3% in sales and customer service occupations due to this the risk of automation to Wandsworth workers is relatively low compared to the England average 24.
The numbers of young people not in education, employment or training in Wandsworth is higher than expected and is also out of line with the pattern of educational attainment (the table below). More information on young people not in education or employment is available in Start Well section of the JSNA.

Source: Nomis - Labour Market Profile–Wandsworth DataWand
4.4 Income
The 2021 Annual Survey of Hours and Earnings (ASHE) estimates that Wandsworth residents working full-time have one of the annual earnings in London and England; £46,936 for males (compared with £33.717 in England) and £41,451 for females (£28,311 in England) 25.
While the local median income is higher than in London and England, 20% of the residents made less than £440.8 pounds per week. In 2012/13, wards with the lowest median household income were Roehampton, Latchmere, Tooting and Graveney. Between 2007 to 2017, the median weekly income (in real terms, after adjusting for inflation) of all London workers dropped by 8.3%. Those working in Wandsworth saw a slightly smaller decrease of 7.4% 26. In 2022, an estimated 19.9% (17,000) of employees in Wandsworth were earning less than £11.05 per hour, which was considered the London Living Wage (LLW). This proportion is amongst the lowest half of London boroughs and since 2008 the proportion of people earning less than the LLW has increased from 15% (14,000) 27.
Gender Pay Gap
Gender pay gap is measured by the absolute difference between median gross hourly earnings (excluding overtime) of men and women as a proportion of median gross hourly earnings (excluding overtime) of men, presented as a percentage. The positive indicator value means that the median men earnings are higher than women by the specified percentage.
Gender pay gap (by workplace location): In 2023, Wandsworth’s rate was 5.3%, which was the 4th lowest in London, 65.8% lower than the England average and 61.0% lower than the London average. The latest Borough figure for 2023 was also 1225.0% higher than in 2011, in comparison with 26.5% decrease in England’s rate in the equivalent time period.
Source: OHID: Public Health Profiles
Source: OHID: Public Health Profiles
Job Seekers Allowance
Jobseeker’s allowance 28 is a working-age benefit for people who are not in full time employment (work less than 16 hours per week) and are available for, and actively seeking work. In February 2019, there were 1,222 JSA claimants in Wandsworth. This was a 14% reduction from the number of claimants in November 2018, (1423 people) and a 46% reduction from the previous year’s value (2,259 people). The greatest majority of JSA claimants in February 2019 were aged 35-44 at 23%; the second highest group to be seeking JSA were the 25–34-year-olds at 16%.
Income Support
Income support is intended to help people on low incomes. Eligible claimants are those who are:
- aged between 16 and pension qualifying age
- in receipt of no/low income and have little savings
- not working or working under 16 hours a week (and/or with a partner working under 24 hours a week) because they are unavailable for full-time employment (e.g., pregnant, lone parents, carers, sick or disabled).
Of the borough’s 16-64-year-old population, 0.9% (2128) were claiming income support in November 2018. This was an 11% reduction from the previous year’s rate of 1%. Wandsworth’s rate was lower than the London and England’s averages of 1.1% and 1.2% respectively 29.
Universal Credit
Universal credit is a payment that helps with living costs. Those claiming are either on low income or out of work. During November 2018, 0.5% (1,298 people) 30 individuals aged 16-64 in employment were claiming universal credit. In the same timeframe, 1.1% (2,565) not in employment were claiming universal credit. Of the 3,844 households on universal credit, 69% (2,634) were single adult households with no dependent child while 24% (917) were single adult households with dependant(s). This is similar to the ‘Universal Credit Roll-Out 2018-19’ briefing paper by the House of Commons which stated that, as of December 2017, around 75% of households in Great Britain on Universal credit are single adult households with no children. By November 2019, 8,170 households in Wandsworth were claiming Universal Credit.
Unemployment
At 4.3%, Wandsworth is estimated to have one of the lowest (7th lowest) unemployment rate in London (not including City of London) in the 12 months to June 2019. The 2011 census showed that Roehampton and Putney Heath had the highest rate of unemployment at 13.7% with the lowest seen in Northcote with 3%. The borough also has a lower claimant count compared to London and England in September 2019 with 4,765 (2.0%) people claiming out of work benefits. Among those aged 16-64 years, 2.0% were claiming out of work benefits. While not working would be the right option for some of the residents, staying out of work can contribute to worsening health outcomes.
In Wandsworth, there were 10,100 (9%), workless households i.e., households where no one aged 16 or older was working. This has dropped from 2004, when there were 15,300 workless households. During 2019, there were 340 16- and 17-years olds not in education, employment or training, this number has increased by 70% since 2017.
5. Vulnerable Groups
5.1 Disabilities
Adults (18+ yrs) with learning disability receiving long- term support from local authorities (per 1,000 population): In 2019/20, Wandsworth’s rate was 3.4 per 1,000 (n=895), which was the 5th highest in London, 2.5% lower than the England average and 0.0% higher than the London average. The latest Borough figure for 2019/20 was also 6.5% higher than in 2014/15, in comparison with 5.6% increase in England’s rate in the equivalent time period.
Source: OHID: Public Health Profiles
Source: OHID: Public Health Profiles
In 2019, 651 people living in Wandsworth aged 65 and over are predicted to have a learning disability. This makes up 7.07% of the 65 and over population in Wandsworth. This is predicted to slightly increase in 2020 (7.17%) before decreasing in 2025 (6.91%). This follows a similar trend to London and England 31. The number of people living with a disability aged 18-64 is estimated to be 5,723 in 2019. Compared to those 65 and over, this is a much smaller proportion of that group at 1.7%.
Of the total population of 18-64-year-olds living in Wandsworth, 2.9% (9,589 people) are estimated to have an impaired mobility in 2019. This number will increase to 885 over the next ten years, however this will only be a 1% increase by 2030.
The rate of people living with sight loss in Wandsworth per 1,000 is lower than the national average. In 2018, the percentage of people living with sight loss compared to overall population is 1.83. A total of 5,250 people is estimated to be living with partial site loss. Of those people 3,900 had low vision site loss and 1,350 had moderate site loss. The number of people with severe site loss (blindness) was a lower estimate at 730 32.
5.2 Poverty
The London Poverty Profile ranks London boroughs on key poverty and inequality indicators. Wandsworth performs well compared to other London boroughs for most indicators such as low pay, unemployment, and poverty. Only 11% of employed residents earn less than the London Living Wage - the joint lowest percentage in London. The unemployment ratio is the second lowest in London, at 3.5%. Additionally, the borough’s poverty rate of 22% is below the London average of 27%.
However, income inequality (the gap in income levels) in Wandsworth is worse than the average for London. The borough also has relatively high premature mortality and homelessness acceptance rates 33.
Child Poverty
End Child Poverty estimates that in 2022 17,239 (25.7%) Wandsworth children live in poverty, once housing costs are considered (the 5th lowest proportion in London). However the proportion of decrease in proportion of children living in poverty between years 2015 and 2022 was 7th lowest in London (2.9% decrease - compared with the London average reduction of 5% in the same time period).
Child benefit is usually paid to those responsible for children (aged under 16). In 2018, 24,555 families in Wandsworth were receiving child benefit, 10th lowest borough in London out of 32 boroughs 34. Since 2012, this number has fallen by 29% from 34,480 families. The majority of families receiving child benefit had one child, 51% (12,560), while 33% (8,000) had two children.
Data from the Department of Work and Pensions describes the number of children living in households where a parent or guardian claimed out-of-work benefits. In 2017, there were 2,190 children aged under five living in all out of work benefit claimant households. This makes up 9.8% of children living in the borough of that age. This is smaller than the percentage rate in Inner London (14.6%) and England as a whole (15.6%) 35. As of 2016, 17.2% of children under 16 were living in low-income families. This is slightly higher than in England (17%) but lower than London (18.8%). This rate has reduced from 10 years prior, where it was at 26.5% in 2006 36.
For some young women, having a child when young can represent a positive turning point in their lives, for others bringing up a child is extremely difficult and often results in poor outcomes for both the teenage parent and the child. Associated poor outcomes include those relating to the baby’s health, the mother’s emotional health and well-being and the likelihood of both the parent and child living in long-term poverty.
For additional information on childhood poverty indicators in PHOF please see Start Well Population section.
Food Poverty
Between April 2018 and March 2019, Wandsworth Foodbank provided a record 5,770 three-day emergency food supplies which was an 11% increase on the previous year, and a 78% increase from 5 years ago.
More than one-third of emergency food supplies were for children (37%), the majority of whom were primary school age or younger. Statutory services made two-thirds (64%) of all referrals with the top three reasons for referral being:
- Income not covering essential costs: This is linked to benefits not keeping pace with the cost of living
- Benefit delays: Currently there is a five week wait for first payment of Universal credit therefore leading to foodbank referral
- Benefit changes: Universal Credit Advance payment is not a solution to Universal Credit’s 5 -week wait. One-third of referrers cited repaying Advance Payment debt as a reason for food bank referral.
Fuel Poverty
Fuel poverty (low income, low energy efficiency methodology): In 2022, Wandsworth’s rate was 8.4% (n=12467), which was the 2nd lowest in London, 35.3% lower than the England average and 18.9% lower than the London average. The latest Borough figure for 2022 was also 35.8% lower than in 2019, in comparison with 2.8% decrease in England’s rate in the equivalent time period.
Source: OHID: Public Health Profiles
Source: OHID: Public Health Profiles
In England, 20% of ethnic minority households live in fuel poverty compared to 10% of households from white ethnic groups. Lone parents with dependent children experienced a higher rate of fuel poverty at 25% compared to couples with dependent children, 15%. A higher rate of fuel poverty was seen amongst those who were unemployed, 32%, compared to those in part-time work, 17%, and in full-time work, 8%.
5.3 Crime and Children and Young People
Over the last 12 months of 17/18, there was a slight increase in the number of young victims of crime (n=1,109) but falls in the number of young suspects (n=1,569) and young people accused of a crime (n=250). Nevertheless, young people, particularly those aged 10-17 remain disproportionally affected by crime in Wandsworth. For young victims, this is most evident within the crime types of violence, sexual offences, and robbery. There continues to be an overrepresentation of BME young people suspected or accused of crime.
More information on youth crime can be found in Start Well.
Violence against Women and Girls
The increasing trend in domestic abuse continued, with an 8.1% rise over 2018. The long-term increase is higher than that experienced in London. This is believed to be heavily influenced by a change in police recording and victim reporting practices in recent years as corresponding increases were not observed in crime survey for England.
The Multi Agency Risk Assessment Conference (MARAC) meet monthly to discuss and manage the highest risk cases of domestic violence in the borough. There were 328 cases heard over the 2018/19 which was a 24% rise on the previous 12-month period. 50% of cases involved a BME victim. While the largest increases were in younger (under 25) (n=49) and older (over 65) (n=24) victims, the most common age group remained 25-34 (n=108). Mental health and substance misuse were a common theme among victims and suspects.
Increases in sexual offending reporting are believed to be linked to the changes in recording and reporting practices.
Violent crime - sexual offences per 1,000 population: In 2022/23, Wandsworth’s rate was 2.1 per 1,000 (n=683), which was the 12th lowest in London, 29.5% lower than the England average and 17.6% lower than the London average. The latest Borough figure for 2022/23 was also 120.7% higher than in 2010/11, in comparison with 250.4% increase in England’s rate in the equivalent time period.
Source: OHID: Public Health Profiles
Source: OHID: Public Health Profiles
5.4 LGBTQ
In 2016, 41.4% (1345) of new STI diagnosis in Wandsworth residents were among gay, bi, and other men who have sex with men (MSM), which is an increase from 37.6% (1152 diagnoses) in 2013. ONS estimates suggest 22% of the LGB population have been diagnosed with a new STI, which is significantly higher than the general population 37.
In July 2017, a survey was launched to gather information about the experiences of LGBTQ people in the UK. This came about because, despite the UK bringing in the Marriage (Same-Sex couples) Act in 2013 as well as introducing ‘Turing’s Law’ in the Policing and Crime Act in 2017, and despite the Parliament now having the highest proportion of openly lesbian, gay, and bisexual members, research and evidence suggests that LGBTQ people still face discrimination, bullying and harassment in education, at work and on the streets. LGBTQ communities also face hate crime and higher inequalities in health satisfaction. Over 108,000 people participated and the results from this resulted in a comprehensive LGBTQ Action Plan that sets out what steps the government will take in response to the findings. The results showed that more than two-thirds of LGBT respondents avoided holding hands with a same-sex partner for fear of negative reaction from others. At least 2 in 5 respondents had experienced an incident, such as verbal harassment or physical violence in the 12 months preceding the survey, because they were LGBTQ. Around 24% of respondents had accessed mental health services in the 12 months preceding the survey 38.
5.5 Homelessness
Statutory homelessness - Eligible homeless people not in priority need: In 2017/18, Wandsworth’s rate was 0.4 per 1,000 (n=59), which was the 7th lowest in London, 45.8% lower than the England average and 0.0% higher than the London average. The latest Borough figure for 2017/18 was also 58.4% lower than in 2010/11, in comparison with 15.6% decrease in England’s rate in the equivalent time period.
Source: OHID: Public Health Profiles
Source: OHID: Public Health Profiles
The ONS has published experimental data on the number of deaths of homeless people in England and Wales, which estimates there were 741 deaths in 2021, in comparison with 688 estimated deaths in the previous year. The data also estimates that Wandsworth had estimated 3 deaths in 2021, down from 1 in 2020 39.
Rough Sleeping
Rough sleeping counts and estimates are single night snapshots of the number of people sleeping rough in local authority areas. Local authorities decide whether to carry out a count or an estimate. They are encouraged to gain intelligence for street counts and estimates from local agencies such as outreach workers, the police, the voluntary sector, and faith groups who have contact with rough sleeper on the street.
An annual report by GLA presents information about people seen rough sleeping by outreach teams in London. Information in this report is derived from the Combined Homelessness and Information Network (CHAIN), a multi-agency database recording information about rough sleepers and the wider street population in London. 2018/19 found 111 people sleeping rough in Wandsworth. This is an increase of 43 people (63%) compared to 2017/18 (68 people seen rough sleeping that year) 40. Wandsworth ranks 14th out of 32 London boroughs for number of rough sleepers and second lowest in Inner London. Increase in rough sleeping has been seen across London and particularly in Inner London boroughs; London has seen rough sleeping increase by 141% since 2009/10. Locally, the increase came after two years of decrease.
Among rough sleepers, 93 (83.7%) were males, 31 were 18-35 years old, 36 were 36-45 years old, 30 were 46-55 years and 14 were 55 years and older, and over 70% were white. Where information was available, 40/79 needed alcohol support, 30/79 needed drugs support, 52/79 needed mental health support and 31/71 had been to prison. In Wandsworth, the highest number of rough sleepers were seen around town centres and major transportation hubs such as Clapham Junction.
© GLA 2021-based demographic projections (2021 Census population: 327,500).↩︎
DataWand: 2021 Census results↩︎
© GLA 2021-based demographic projections for year 2024↩︎
London Datastore, Land Area and Population Density,2001-2050. Data used: 2023. URL: https://data.london.gov.uk/dataset/land-area-and-population-density-ward-and-borough↩︎
GLA 2021-based Demographic Projections. Past Delivery, 10-year migration, NUTS2 Constrained↩︎
DataWand: 2021 Census results↩︎
DataWand. URL: https://www.datawand.info/population/#/view-report/63aeddf1d7fc44b8b4dffcd868e84eac/___iaFirstFeature/G3↩︎
Department of Education. London Data Store. Percentage of Pupils by First Language,2007-2018. URL: https://data.london.gov.uk/dataset/first-language-spoken-home-borough↩︎
Office of National Statistics, Parents’ country of birth. 2022. URL: https://www.ons.gov.uk/peoplepopulationandcommunity/birthsdeathsandmarriages/livebirths/datasets/parentscountryofbirth↩︎
Office of National Statistics, Birth characteristics, 2017. URL: https://www.ons.gov.uk/peoplepopulationandcommunity/birthsdeathsandmarriages/livebirths/datasets/birthcharacteristicsinenglandandwales↩︎
London Datastore, Probability of loneliness for those aged 65 and over, 2011. URL: https://data.london.gov.uk/dataset/probability-of-loneliness-for-those-aged-65-and-over↩︎
Wandsworth Council. Voluntary and community sector. URL: https://www.wandsworth.gov.uk/wandsworth-civic-awards↩︎
London Datastore. Volunteering Work Among Adults, 2008-2016. Data used: 2016. URL: https://data.london.gov.uk/dataset/volunteering-work-among-adults-borough↩︎
Office of National Statistics. Deaths registered in England and Wales, 2021. URL: https://www.ons.gov.uk/peoplepopulationandcommunity/birthsdeathsandmarriages/deaths/datasets/deathsregisteredinenglandandwalesseriesdrreferencetables↩︎
London Datastore. Migration Indicators: New Migrant GP Registrations,2001-2018. Data used: 2014-2018. URL: https://data.london.gov.uk/dataset/migration-indicators↩︎
Department for Work and Pensions, National Insurance number allocation, June 2019. URL: https://www.gov.uk/government/collections/national-insurance-number-allocations-to-adult-overseas-nationals-entering-the-uk↩︎
London Datastore. National Insurance Number Registrations of Overseas Nationals, Borough, MSOA. 2002/03 to 2018/19. Data used 2018/19. URL: https://data.london.gov.uk/dataset/national-insurance-number-registrations-overseas-nationals-borough↩︎
De Hert M et al. Physical illness in patients with severe mental disorders. I. Prevalence, impact of medications and disparities in health care. World Psychiatry. 2011;10(1):52–77. URL: https://www.ncbi.nlm.nih.gov/pmc/articles/PMC3048500 ↩︎
GOV.UK. Special Education needs in England. URL: https://www.gov.uk/government/statistics/special-educational-needs-in-england-january-2019 ↩︎
DataWand. Economy Report for Wandsworth. URL: https://www.datawand.info/economy-and-employment/#/view-report/9e93e3faae4c449084e459fcd86e88d0/___iaFirstFeature/G3↩︎
DataWand. Economy Report for Wandsworth. URL: https://www.datawand.info/economy-and-employment/#/view-report/9e93e3faae4c449084e459fcd86e88d0/___iaFirstFeature/G3↩︎
DataWand. Economy Report for Wandsworth. URL: https://www.datawand.info/economy-and-employment/#/view-report/9e93e3faae4c449084e459fcd86e88d0/___iaFirstFeature/G3 ↩︎
Office of National Statistics. Which occupations are at higher risk of being automated, 2017. URL: https://www.ons.gov.uk/employmentandlabourmarket/peopleinwork/employmentandemployeetypes/articles/whichoccupationsareathighestriskofbeingautomated/2019-03-25 ↩︎
DataWand. Economy Report for Wandsworth. URL: https://www.datawand.info/economy-and-employment/#/view-report/9e93e3faae4c449084e459fcd86e88d0/___iaFirstFeature/G3 ↩︎
DataWand. Economy Report for Wandsworth. URL: https://www.datawand.info/economy-and-employment/#/view-report/9e93e3faae4c449084e459fcd86e88d0/___iaFirstFeature/G3 ↩︎
London Datastore. Place based median earnings (Gross Weekly), by Full time and Gender (ONS). 2018. URL: https://data.london.gov.uk/dataset/earnings-workplace-borough ↩︎
London Datastore. Employees earning below the London Living Wage (LLW). 2022. URL: https://data.london.gov.uk/dataset/earning-below-llw ↩︎
Stat-Xplore Universal credit. URL: https://stat-xplore.dwp.gov.uk/webapi/jsf/login.xhtml?invalidSession=true&reason=Session+not+established ↩︎
London Datastore. Income Support Claimants, 1999-2018. Data used: 2018. URL: https://data.london.gov.uk/dataset/income-support-claimants-borough ↩︎
Stat-Xplore Universal credit. URL: https://stat-xplore.dwp.gov.uk/webapi/jsf/login.xhtml?invalidSession=true&reason=Session+not+established ↩︎
Poppi, LD–Baseline estimates Data used: 2019, 2020 and 2025. URL: https://www.poppi.org.uk/index.php?pageNo=374&sc=1&loc=8364&np=1↩︎
RNIB, Site Loss Data Tool. URL: https://www.rnib.org.uk/professionals/health-social-care-education-professionals/knowledge-and-research-hub/sight-loss-data-tool/ ↩︎
London Datastore Child Benefits, Borough. 2003-2018. URL: https://trustforlondon.org.uk/data/boroughs/wandsworth-poverty-and-inequality-indicators/?tab=work ↩︎
London Datastore Child Benefits, Borough. 2003-2018. URL: https://data.london.gov.uk/dataset/children-poverty-borough ↩︎
London Datastore, Children out work benefit households, 2010-2017. Data used: 2017. URL: https://data.london.gov.uk/dataset/children-out-work-benefit-households-borough ↩︎
London Datastore, Children in Poverty–Borough, 2006-2016. Data used: 2016. URL: https://data.london.gov.uk/dataset/children-poverty-borough ↩︎
DataWand, Sexual Health Needs Assessment, 2018. URL: https://www.datawand.info/wp-content/uploads/2018/12/LBW_SexualHealth_NeedsAssessment_2018.pdf ↩︎
National LGBT Survey. Summary report, July 2018 Government Equalities Office. URL: https://assets.publishing.service.gov.uk/government/uploads/system/uploads/attachment_data/file/722314/GEO-LGBT-Survey-Report.pdf ↩︎
ONS. Deaths of homeless people in England and Wales: 2018. 2013-2018. Data used: 2021. URL: https://www.ons.gov.uk/peoplepopulationandcommunity/birthsdeathsandmarriages/deaths/datasets/deathsofhomelesspeopleinenglandandwales ↩︎
London Datastore, Rough sleeping in London (CHAIN reports), 2014-2019, Data used: 2017-2019. URL: https://data.london.gov.uk/dataset/chain-reports ↩︎
