JSNA Age Well
1. Introduction
The population is ageing with the large cohort of people now reaching their later years. This increased demand is only set to continue as the population is living longer. By tackling wellbeing earlier in the life course, the outcomes for older people can be significantly improved and the most vulnerable people in society will continue to have access to high quality services. Important resources that have been used to compile the JSNA include use of the following, alongside additional background information, data, and intelligence:
- Office for Health Improvement & Disparities (OHID)
- Quality and Outcomes Framework (QOF)
- Projecting Adult Needs and Service Information (PANSI)
- Projecting Older People Population Information (POPPI)
- NHS Digital
- Office for National Statistics
- NHS England Statistics
- Wandsworth Health and Care Plan
- eSouth West London STP. Care Home Data Pack 2019
- Wandsworth Dementia HNA 2019
- DataWand.
1.1 Demographics
For latest demographic information please go to the population explorer on DataWand.
Population
65+ Population Pyramid
In Wandsworth in 2024, 9.9% (n=33,154) of the total population were 65 years old and over. The proportion of people aged 65+ in the borough is 19.6% lower than the London average of 12.3%.
In line with the national picture, the number of older people in Wandsworth is increasing, many of whom will live with age-related needs that will make them more vulnerable to experiencing difficulties with mobility and personal care. The population of residents aged 65+ is projected to increase between 2023 and 2041 by 58.7% (from 32,468 in 2023 to 51,617 in 2041).
Source: © GLA 2021-based demographic projections. Housing-led population projections. Past Delivery 10-year migration, 2023
Ethnicity Breakdown of Population Aged 65+
In Wandsworth in 2024, 28.2% (n=9,772) of the total population aged under 18 were from BAME ethnic groups. The proportion of residents aged 65+ from BAME ethnic groups in the borough is 9.7% lower than the London average of 31.3%.
Source: © GLA 2016-based Demographic Projections, 2017
1.2 Life Expectancy at Age 65
Life expectancy at age 65 is an estimate of the average number of years at age 65 a person would survive if he or she experienced the age-specific mortality rates for that area and time period throughout his or her life after that age. Healthy life expectancy at age 65 shows the years a person can expect to live in good health beyond 65 years, rather than with a disability or in poor health.
Males
Life expectancy at 65: In 2020 - 22, Wandsworth’s rate was 18.3 years, which was the 15th highest in London, 0.4% lower than the England average and 0.1% higher than the London average. The latest Borough figure for 2020 - 22 was also 16.0% higher than in 2001 - 03, in comparison with 12.9% increase in England’s rate in the equivalent time period.
Source: OHID: Public Health Profiles
Source: OHID: Public Health Profiles
Females
Life expectancy at 65: In 2020 - 22, Wandsworth’s rate was 21.6 years, which was the 13th highest in London, 3.2% higher than the England average and 1.2% higher than the London average. The latest Borough figure for 2020 - 22 was also 13.6% higher than in 2001 - 03, in comparison with 8.7% increase in England’s rate in the equivalent time period.
Source: OHID: Public Health Profiles
Source: OHID: Public Health Profiles
1.3 Healthy Life Expectancy at Age 65
Males
Healthy life expectancy at 65: In 2018 - 20, Wandsworth’s rate was 10.3 years, which was the 16th lowest in London, 1.6% lower than the England average and 0.3% higher than the London average. The latest Borough figure for 2018 - 20 was also 5.2% lower than in 2009 - 11, in comparison with 5.8% increase in England’s rate in the equivalent time period.
Source: OHID: Public Health Profiles
Source: OHID: Public Health Profiles
Females
Healthy life expectancy at 65: In 2018 - 20, Wandsworth’s rate was 14.3 years, which was the 2nd highest in London, 26.2% higher than the England average and 28.3% higher than the London average. The latest Borough figure for 2018 - 20 was also 2.1% higher than in 2009 - 11, in comparison with 6.6% increase in England’s rate in the equivalent time period.
Source: OHID: Public Health Profiles
Source: OHID: Public Health Profiles
1.4 Inequalities in Life Expectancy at Age 65
Males
Inequality in life expectancy at 65: In 2018 - 20, Wandsworth’s rate was 3.7 years, which was the 9th lowest in London, 28.8% lower than the England average and 22.9% lower than the London average. The latest Borough figure for 2018 - 20 was also 14.0% lower than in 2010 - 12, in comparison with 13.0% increase in England’s rate in the equivalent time period.
Source: OHID: Public Health Profiles
Source: OHID: Public Health Profiles
Females
Inequality in life expectancy at 65: In 2018 - 20, Wandsworth’s rate was 4.0 years, which was the 12th highest in London, 16.7% lower than the England average and 11.1% higher than the London average. The latest Borough figure for 2018 - 20 was also 11.1% higher than in 2010 - 12, in comparison with 20.0% increase in England’s rate in the equivalent time period.
Source: OHID: Public Health Profiles
Source: OHID: Public Health Profiles
1.5 Ward-level Life Expectancy at Age 65
The latest (2010–14) Ward-level life expectancy at age 65 and percentage change in life expectancy since 2002–06 (the figure below) Life expectancy at age 65 was the highest in three wards in the least deprived quintile, the same Wards had the highest life expectancy at birth. The relationship between deprivation and life expectancy at age 65 in other deprivation quintiles is less clear, with the most deprived wards having either average or low life expectancy (LE) at age 65. There was a substantial variation in relative gains in life expectancy at age 65 at a Ward-level. Bedford was the only Ward with percentage decrease in life expectancy at age 65 between 2002–06 and 2010–14 (4.6% reduction in LE at age 65). The highest gains in life expectancy at age 65 of over 20% were recorded in Northcote, Earlsfield and Latchmere.
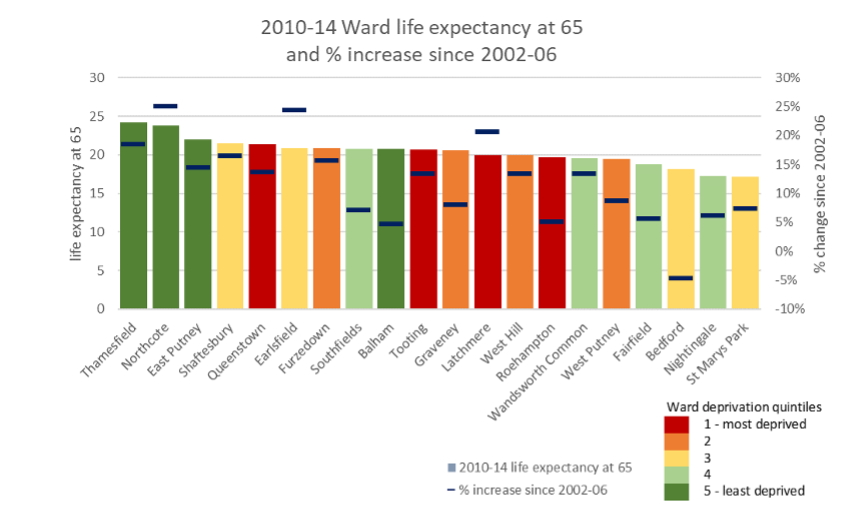
Source: London DataStore: Life Expectancy at Birth and Age 65 by Ward and London Wards Indices of Deprivation
2. Main Causes of Morbidity and Mortality
The Global Burden of Disease (GBD) 1 provides modelled estimates of the burden of poor health and disability. The burden of disease analysis is a way to compare the impact of different diseases, conditions or injuries in a population and break it down by age group. The only age group for older adults that is available in the GBD toolkits is 70 and over. The impact of disease on Wandsworth older adults can be divided into morbidity (living with a disease) and mortality (dying from a disease).
2.1 Morbidity in Older Adults
The GBD also provides modelled estimates of the burden that can be attributed to a number of risk factors. It uses years lived with disability (YLD) to attribute the burden of morbidity. YLD is a measure of morbidity that combines the prevalence of each disease with a rating of the severity of its symptoms (excluding death itself), to give an overall measure of the loss of quality of life.
Low back pain, age related hearing loss, Chronic Obstructive Pulmonary Disease (COPD) , followed by lower back pain and falls were the most common causes of YLD in both Wandsworth and London males. For females, the top four causes are the same for Wandsworth and London: lower back pain, diabetes, hearing loss and falls. COPD was the 5th most frequent cause in London, whereas for Wandsworth’s females, it was Osteoarthritis (table below).
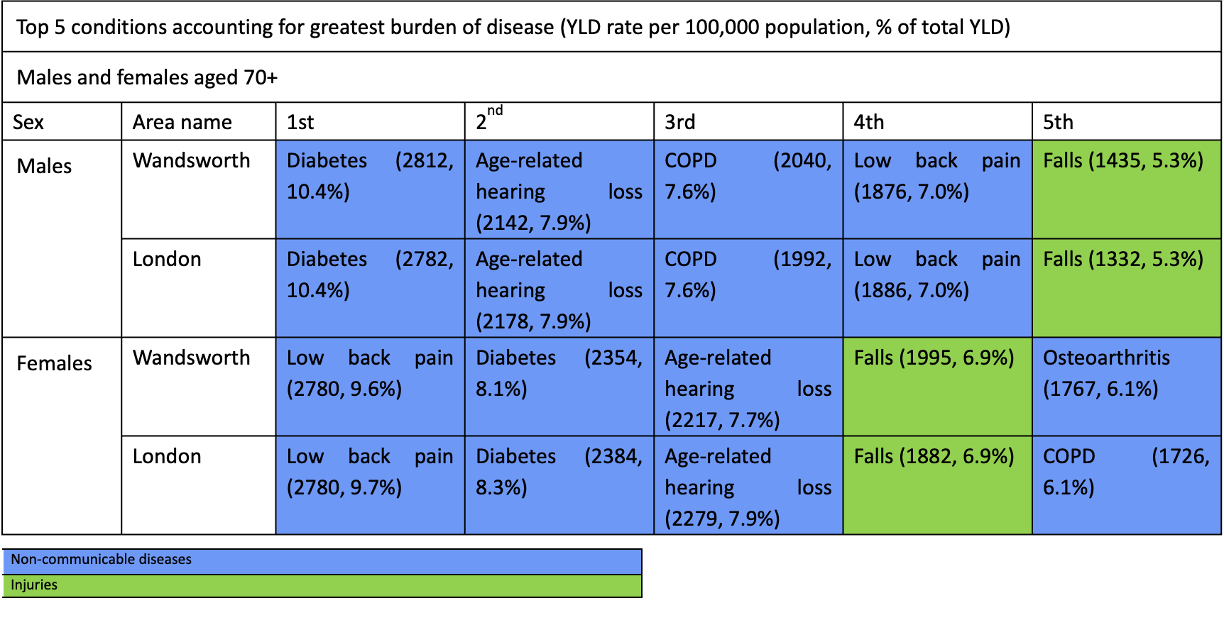
Source: Global Burden of Disease. 2019
2.2 Mortality in Older Adults
In 2019, ischaemic heart disease was the leading cause of death in males aged over 70 years, followed by COPD and lower respiratory infections. Top 5 causes of death in London were the same; the main difference was in mortality rate from heart disease: Wandsworth’s rate was 14% lower than the London average rate (785 per 100,000 vs. 912 per 100,000 population).
In females aged over 70 years, ischaemic heart disease, lower respiratory infections and Alzheimer’s disease were the leading causes of death in Wandsworth and in London (table below).
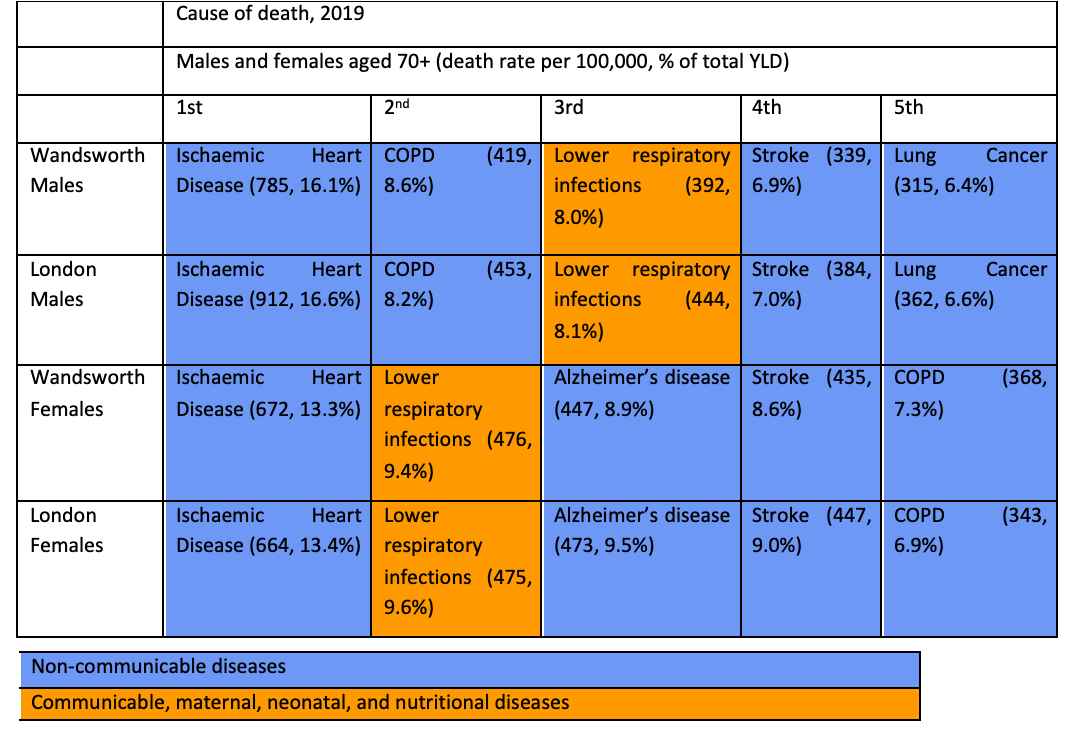
Source: Global Burden of Disease. 2019
Mortality Risk Factors
Causes of death in the population are influenced by a broad range of factors. Using the Global Burden of Disease, certain risk factors for disease can be ranked based on the proportion of deaths they are associated with. Risk factors are divided into 3 main groups: behavioural, metabolic and environmental.
The risk factors accounting for the highest proportion of deaths among those aged over 70 years was tobacco, high blood pressure, high fasting plasma glucose and dietary risks. Smoking accounted for deaths from five major causes: neoplasms, chronic respiratory diseases, cardiovascular diseases, respiratory diseases and respiratory infections (figure below).
High blood pressure accounted for deaths from two main causes, cardiovascular diseases (heart disease and stroke) and diabetes and kidney diseases. High blood sugar level contributed to cardiovascular, cancer, diabetes and kidney diseases. Dietary risks in this age group contributed to deaths predominantly from cardiovascular disease.

Source: Global Burden of Disease. 2019
Mortality Rates by Cause
Cardiovascular Death Rate
Mortality rate from all cardiovascular diseases, ages 65+ years: In 2021, Wandsworth’s rate was 879.9 per 100,000 65+ (n=276), which was the 6th lowest in London, 13.9% lower than the England average and 13.4% lower than the London average. Time series data were not available for this indicator.
Source: OHID: Public Health Profiles
Respiratory Death Rate
Mortality rate from respiratory disease, ages 65+ years: In 2021, Wandsworth’s rate was 399.8 per 100,000 65+ (n=125), which was the 16th highest in London, 9.3% lower than the England average and 3.5% lower than the London average. Time series data were not available for this indicator.
Source: OHID: Public Health Profiles
Cancer Death Rate
Mortality rate from cancer, ages 65+ years: In 2021, Wandsworth’s rate was 920.2 per 100,000 65+ (n=289), which was the 12th lowest in London, 10.7% lower than the England average and 3.2% lower than the London average. Time series data were not available for this indicator.
Source: OHID: Public Health Profiles
Excess Winter Deaths
The number of excess winter deaths is linked to the outside temperature and the underlying level of disease in the population as well as other factors, such as how well-equipped people, and their environments, are to cope with the drop in temperature.
Winter mortality index (age 85 plus): In Aug 2021 - Jul 2022, Wandsworth’s rate was 22.4% (n=40), which was the 11th highest in London, 98.2% higher than the England average and 60.0% higher than the London average. The latest Borough figure for Aug 2021 - Jul 2022 was also 23.8% lower than in Aug 2001 - Jul 2002, in comparison with 55.2% decrease in England’s rate in the equivalent time period.
Source: OHID: Public Health Profiles
Source: OHID: Public Health Profiles
2.3 Common Mental Disorders
The estimated prevalence of common mental disorders (CMD) in older people provides a valuable resource in the planning of preventative mental health interventions, such as psychological therapies. The indicator is designed to estimate local prevalence of CMD using national survey estimates for specific population cohorts and applying them to local demography.
Estimated prevalence of common mental disorders: % of population aged 65 & over: In 2017, Wandsworth’s rate was 11.4% (n=3474), which was the 16th lowest in London, 11.2% higher than the England average and 1.0% higher than the London average. Time series data were not available for this indicator.
Source: OHID: Public Health Profiles
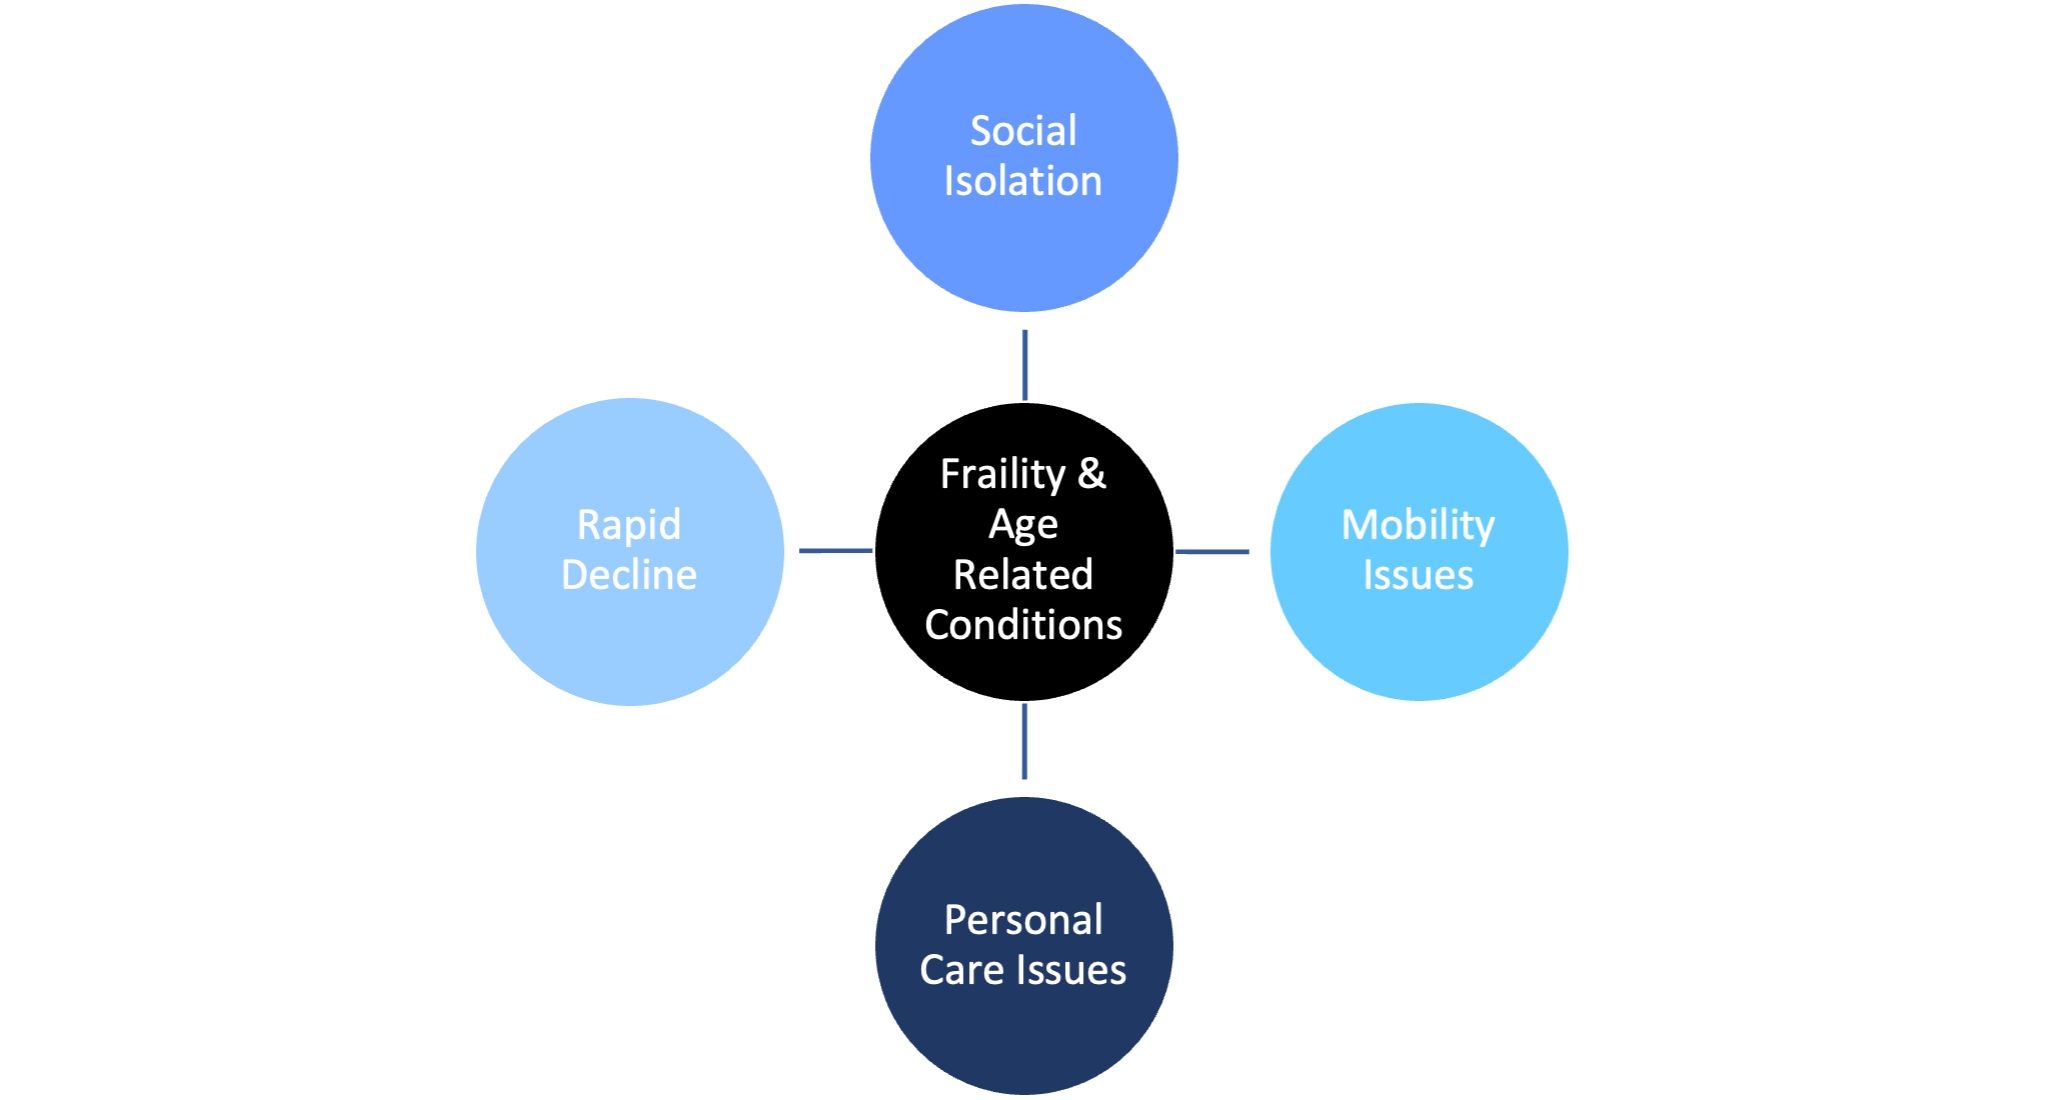
3. Falls, Frailty and Mobility
Ageing, as a ‘slowing down’ process 2, can turn simple activities into barriers that prevent a person from living healthily and safely in the community. As people age, it is likely that they will experience some degree of difficulty with activities of daily living (ADL) including:
- Mobility - the capability to move independently or with assistive devices around an environment3. In this chapter, having difficulties with one or more mobility tasks classifies as having issues with mobility. Tasks may include getting up and down the stairs, walking down the road, and moving around the house 4.
- Personal care - the completion of tasks to maintain personal hygiene, such as washing, toileting and administering medicines
- Domestic care–the activities to maintain a healthy living environment, including cooking meals and cleaning.
Due to the sequence of escalation, some older people may struggle to cope with domestic tasks yet are still able to be independent with their personal care. However, all the above can be exacerbated by issues with frailty.
The ageing process presents a variety of challenges for older people from frailty, illnesses and age-related conditions, such as Dementia. As a result, some older people may have needs that require support from social care service, as they are unable to cope with basic self-care tasks.
Frailty is a state of low energy, slower walking speeds and poor strength5. It is not an inevitable consequence of the ageing process, however, prevalence rates for frailty do increase with age (figure below). Women are also more likely to be affected by frailty in comparison to men. The severity of frailty has also been found to increase dramatically in the year prior to death 6.
The impact of ageing and loss of independence may not only have a detrimental impact on a person’s life but also places strain on the overall health and social care system due to the need for costly and intensive support services. These services are underpinned by the statutory obligations outlined in the Care Act 2014. The Act places a duty on Local Authorities to promote person-centred care that acknowledges the physical, mental and emotional well-being of the person. The aim is to achieve this through strengths-based and preventative care and support services. This is because many age-related conditions that exacerbate mobility and personal care issues can be reduced, delayed or prevented by early lifestyle adjustments and interventions.
3.1 Falls
A fall is defined as an event which causes a person to, unintentionally, rest on the ground or lower level, and is not a result of a major intrinsic event or overwhelming hazard 7.
The human cost of falling includes distress, pain, injury, loss of confidence, loss of independence and mortality. Falling also affects the family members and carers of people who fall.
Financially, unaddressed fall hazards in the home are estimated to cost the NHS in England £435 million. The total annual cost of fragility fractures to the UK has been estimated at £4.4 billion which includes £1.1 billion for social care; hip fractures account for around £2 billion of this sum. Short and long-term outlooks for patients are poor following a hip fracture, with an increased one-year mortality risk of between 18% and 33% and negative effects on daily living activities such as shopping and walking 8.
As people get older, they are more likely to fall over. falls can become recurrent and result in injuries including head injuries and hip fractures.
Falls and fall-related injuries are a common and serious problem for
older people. People aged 65 and older have the highest risk of falling,
with 30% of people older than 65, and 50% of people older than 80
falling at least once a year 9.
Amongst older people living in the community, 5% of those who fall in a
given year will end up with fractures and hospitalisation. One in two
women and one in five men in the UK will experience a fracture after the
age of 50 10.
The causes of having a fall are often multifactorial and occur due to the presence of risk factors. Risk factors for falls include, but are not limited to, having a history of falls, muscle weakness, poor balance, visual impairment, polypharmacy, environmental hazards and a number of specific conditions ^{URL: https://www.gov.uk/government/publications/falls-applying-all-our-health/falls-applying-all-our-health].
3.2 Hospital Admissions due to a Fall
Falls are the largest cause of emergency hospital admissions for people aged 65+, and impact on long term health outcomes of older adults; often resulting in people moving from their own home to long-term nursing or residential care.
Emergency hospital admissions due to falls in people aged 65 and over: In 2022/23, Wandsworth’s rate was 2187.4 per 100,000 (n=705), which was the 10th highest in London, 13.2% higher than the England average and 5.6% higher than the London average. The latest Borough figure for 2022/23 was also 12.0% lower than in 2010/11, in comparison with 9.1% decrease in England’s rate in the equivalent time period.
Source: OHID: Public Health Profiles
Source: OHID: Public Health Profiles
Emergency hospital admissions due to falls in people aged 65 to 79: In 2022/23, Wandsworth’s rate was 1197.7 per 100,000 (n=280), which was the 6th highest in London, 29.0% higher than the England average and 12.6% higher than the London average. The latest Borough figure for 2022/23 was also 10.4% lower than in 2010/11, in comparison with 10.5% decrease in England’s rate in the equivalent time period.
Source: OHID: Public Health Profiles
Source: OHID: Public Health Profiles
3.3 Hip Fractures
Hip fracture, in many cases a result of a fall, affects mobility of older people–only around 30% of the affected people return to the levels of independence prior to the fracture and one in three ends up leaving their own home and moving to long-term care 11.
Hip fractures in people aged 65 and over: In 2022/23, Wandsworth’s rate was 507.8 per 100,000 (n=165), which was the 14th highest in London, 9.0% lower than the England average and 1.1% higher than the London average. The latest Borough figure for 2022/23 was also 11.7% lower than in 2010/11, in comparison with 9.3% decrease in England’s rate in the equivalent time period.
Source: OHID: Public Health Profiles
Source: OHID: Public Health Profiles
3.4 Falls Services in Wandsworth
The Wandsworth Integrated Falls and Bone Health Service (IFBHS) was commissioned in 2012/13 needs. The IFBHS offered a holistic and preventative approach to falls which replaced the post-hoc falls management approach taken by prior services.
IFBHS is provided by St George’s NHS Foundation Trust and has the following aims:
- Reduction in the number of unscheduled admissions for people who have experienced a hip or other fragility fracture, due to falls
- Increase in the number of appropriate individuals people receiving a falls and bone health risk assessment
- Increase in the number of people in target groups undergoing an individually tailored community or home-based therapeutic exercise programme
- Increase in the number of people who are on appropriate medication and are adhering to medication advice.
- Reduction in the rate recurrent fragility fractures in the longer term
- Improved quality of life for people at risk of falls
- Reduction in the fear of falling
- Improved physical measures.
The service includes clinical staff (physiotherapists and occupational therapists) and group-based activities (e.g., Otago Falls prevention, Bone BOOST) delivered in the hospital or community settings.
3.5 Evidence Based Interventions in Falls Prevention
NICE and Public Health England lead on providing evidence-based guidance with regards to falls prevention, outlining approaches to interventions and activities helping to prevent falls and fractures in older people.
NICE guideline 12 recommends strength and balance training as part of an individualised multifactorial intervention. Those most likely to benefit are older people living in the community with a history of recurrent falls and/or balance and gait deficit. A muscle-strengthening and balance programme should be individually prescribed and monitored by an appropriately trained professional.
The National Falls Prevention Coordination Group’s Falls and fracture consensus statement (2017) advocates a collaborative and whole system approach to prevention, response and treatment 13. This includes:
- Promoting healthy ageing across the life-course
- Evidence-based case finding and risk assessment
- Evidence-based strength and balance exercise programmes and opportunities for those at low to moderate risk of falls
- Ensuring safe homes
- Demonstrating actions to reduce risk in high-risk health and care environments
- Fracture liaison services
- Evidence-based collaborative care for falls-related severe injury.
Interventions for older people living in the community with a low to moderate risk of falling should include strength and balance exercise programmes. These programmes are effective for primary and secondary falls and non-vertebral fractures in older people, but more effective for those who have a history of recurrent falls or who have a balance or gait deficit 14.
While there is evidence that walking has numerous health benefits for older people in general, it should not be included in programmes for participants considered at high risk of falling as this may result in further falls.
In order to be effective, programmes must:
- be continued over a duration of at least 50 hours
- be carried out two to three times a week
- challenge balance and improve strength through resistance training and exercise in a standing position
- be sufficiently progressive
- be tailored to the individual; pitched at the right level, taking falls history and medical conditions into account
- be delivered by specially trained Instructors.
At the end of the programme, older people should be assessed and offered a range of follow-on classes. These should suit their needs and abilities, include strength, balance, and support their progression.
Falls prevention requires a collaborative and comprehensive approach (figure below) by the possible model of a falls prevention care pathway published by Age UK.
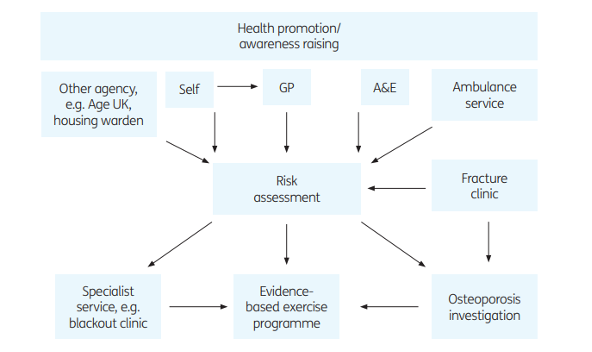
Source: Age UK
Age UK advise that services should offer a choice of and referral to an evidence-based exercise programme such as the Otago Exercise Programme or Postural Stability. For those who have not had a fall, effective exercise programmes can also include tai chi, dancing and other general exercise classes that include components of strength and balance 15.
There is evidence of cost-effectiveness for certain falls prevention interventions including:
- Falls Management Exercise (FaME) Group Programme
- Otago Home Exercise
- Tai Chi Group Exercise
- Home Assessment and Modification (HAM)–in which relevant professional risk assess a person’s usual place of residence to identify environmental hazards and carries out actions to reduce these.
A tool, commissioned by PHE, was developed to assess the return on investment (ROI) for these 4 programmes. The findings from this analysis indicate that all 4 interventions could be considered cost-effective when compared with usual care (i.e., no falls prevention service) in an English setting. It was noted that 1 out of the 4 interventions (home assessment and modification) should produce a positive financial return. For the remaining 3 interventions (Otago, FaME and Tai Chi) it was noted that, whilst not providing a positive financial ROI, there would be a positive societal return (i.e., improved quality of life) on the initial investment 16 17.
An internal falls prevention exercise evidence review (2019), carried out by Richmond and Wandsworth Public Health team, found literature to support Otago and Tai Chi. Evidence was found to support Tai Chi for reducing falls, or risk of falls, among elderly people, although, not for those who are frail. There was also evidence to suggest that alternative models of Otago in the community could be effective; although it was noted that further studies would be required to confirm and develop these findings.
Group-based exercise has been shown to be effective; however, this should be targeted group exercise that had been individually prescribed. Evidence also showed that home-based exercise could reduce the rate of falls the risk of falls, which could benefit those unable or reluctant to attend group classes.
Overall, the optimum approach for older people living in the community at risk of falling should include strength and balance exercise. Evidence-based exercise programmes recommended are FaME, Otago, and Tai Chi, and should be prioritised for consideration for local falls prevention exercise programmes. Other interventions reviewed provide benefits for strength and/or balance, such as dance, Pilates, yoga and Nordic Walking, but more research is needed to confirm their effectiveness in preventing falls among older people.
Falls prevention requires a multi-disciplinary, collaborative and whole-systems approach, with priority towards recognising individuals at risk and adopting a personalised yet multi-faceted approach to falls prevention.
4. Care and Support Services for Older People
When an older person finds themselves requiring care and support, they can arrange their care privately or through the Local Authority. The Local Authority will financially support people eligible needs and who are under the financial threshold. Care and support can either be provided in the community or in accommodation-based settings. Wandsworth Council will first explore the opportunities with community-based care as they enable the person to live independently in their own home. In turn, this helps the individual to build resilience and have more choice and control. Whether a person can receive care in the community, depends on their level of need. These services for older people include:
- Home Care
- Blitz Clean
- Delivered Meals
- Specialist Day Centre for Adults with Dementia
- Specialist Day Centre for Adults with A Physical Disability and Older People
- Open Access Centres
- Advocacy Services
- Community Equipment including Telecare.
An older person may require help with preparing food, cleaning, or personal care; therefore, an appropriate service would be delivered meals or a support worker to provide help at set times throughout the day. Additional support can also be provided through simple aids and equipment, such as walking frames, handles and washing aids, which can assist people to live independently in their own home to prevent accidents and personal neglect. This may also include the use of assistive technologies and Telecare. More complex needs can be supported through the Disabled Facilities Grant (DFG) which funds housing renovations to accommodate changing needs, such as ramps, stairlifts and door widening. All these services help people to complete practical daily tasks, however, other day services are focused on wider wellbeing of the person.
Older people are encouraged to participate in the community through day centre provisions located across the Borough. Depending on the scope of the service, they can socialise, learn new skills and can access hot meals. For example, the Wandsworth Asian Women’s Association provides a drop-in service for Asian women in the community to attend a lunch club, socialise and obtain information on health and social care services. Some of the community services are run by the voluntary sector, such as the successful partnership with Age UK Wandsworth. Examples of their services include providing a befriending service to tackle the issue of social isolation; a shopping service to ensure that older people can remain safely in their own home and a handyperson service for ad-hoc tasks that may be difficult to complete as an older person 18. As Wandsworth Council works to align its services towards a prevention agenda, the role of the voluntary sector will continue to be of critical importance.
Community-based support is not safe or appropriate for all older people. Individuals with higher levels of need may receive more intensive accommodation-based services, which fall into three main types of services:
- Extra Care
- Residential Care
- Nursing Homes.
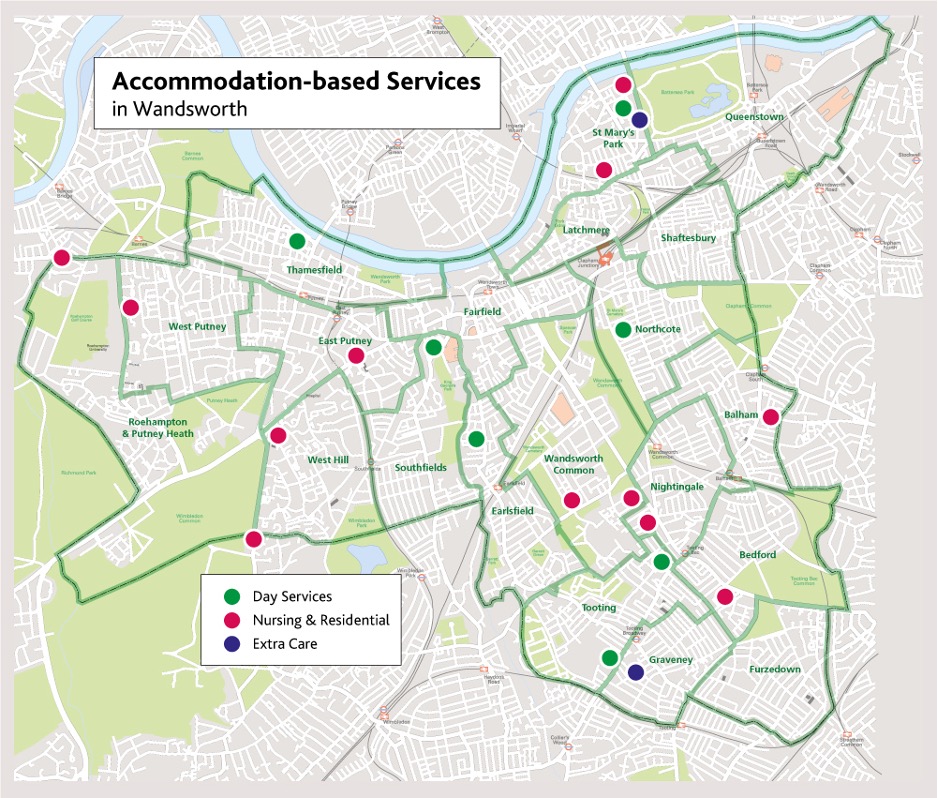
In Wandsworth, there are 8 commissioned residential homes, 16 commissioned nursing homes, 3 commissioned extra care schemes and 2 commissioned day services (see the figure below). Please note that this does not include services that Local Authority does not commission.
The services above for older people are either available for all older people or means tested depending on the type of service. For someone to receive accommodation-based and home care services they must meet the conditions set out in the Care Act and have less than £23,250 in capital/and or savings to receive council funded care and support services. However, the challenge to meet demand will continue to grow alongside the estimated growth in the population of older people, including those aged 85 years and over who have the highest care and support needs. Therefore, there will be a future unmet need in services for older people if service capacity remains the same as present levels.
Furthermore, Covid-19 has significantly impacted older people; the extent of which is not yet fully understood. For example, Covid-19 may impact on population predictions due to the higher death rates in 2020 of people aged 65 years and over. Many older people may be living with the symptoms of ‘long-term’ Covid-19. Furthermore, many older people may experience cognitive decline or mental health issues from having to live in isolation from other people. At this stage, it is unknown how far-reaching the impact of Covid-19 has been on older people; however, it is expected to be significant. Wandsworth Council will need to continue to support people by ensuring the aspirations of the Care Act 2014 are embedded into the care system and commissioning of services, considering the impact of Covid-19.
6. Vaccinations
Vaccination coverage is the best indicator of the level of protection a population will have against vaccine preventable communicable diseases. There are three vaccinations routinely offered to people aged 65 and over: seasonal flu vaccine, pneumococcal polysaccharide vaccine (PPV) and shingles vaccine.
6.1 Seasonal Flu Vaccine
Population vaccination coverage: Flu (aged 65 and over): In 2022/23, Wandsworth’s rate was 66.2% (n=24881), which was the 15th lowest in London, 17.1% lower than the England average and 3.1% lower than the London average. The latest Borough figure for 2022/23 was also 5.6% lower than in 2010/11, in comparison with 9.6% increase in England’s rate in the equivalent time period.
Source: OHID: Public Health Profiles
Source: OHID: Public Health Profiles
6.2. Pneumococcal Polysaccharide Vaccine
Population vaccination coverage: PPV: In 2022/23, Wandsworth’s rate was 63.8% (n=22345), which was the 10th lowest in London, 11.2% lower than the England average and 5.0% lower than the London average. The latest Borough figure for 2022/23 was also 7.4% higher than in 2010/11, in comparison with 1.9% increase in England’s rate in the equivalent time period.
Source: OHID: Public Health Profiles
Source: OHID: Public Health Profiles
6.3 Shingles Vaccine
Population vaccination coverage: Shingles vaccination coverage (71 years): In 2022/23, Wandsworth’s rate was 45.9% (n=829), which was the 8th highest in London, 5.0% lower than the England average and 12.6% higher than the London average. The latest Borough figure for 2022/23 was also 4.5% higher than in 2018/19, in comparison with 1.6% decrease in England’s rate in the equivalent time period.
Source: OHID: Public Health Profiles
Source: OHID: Public Health Profiles
7. Dementia Prevention and Care
This Dementia section builds on the 2019 Dementia Health Needs Assessment and provides a common view of health and care needs for local Dementia residents and their carers. It documents current service provision, identifies gaps in health and care services, identifies unmet needs, and details evidence of effectiveness for different health and care interventions. Furthermore, it draws on a wide range of quantitative and qualitative data to bring together information from different sources and partners to create a shared evidence base, which supports health and social care service planning, decision-making, and delivery. It can also utilise by other organisations, including the voluntary and community sector, to plan services that meet the needs of the local population.
Dementia is a progressive disease often associated with complex health and social care needs; these needs are expected to increase in Wandsworth, as a result of expected increases in numbers of older adults living in the Borough. There are several gaps and opportunities that should be addressed to improve the Dementia offer across Wandsworth. Therefore, enacting a comprehensive Dementia prevention and care support offer for residents affected by and living with Dementia remains a key focus for Wandsworth council alongside partners across the health and social care arena.
7.1 Definition of Dementia
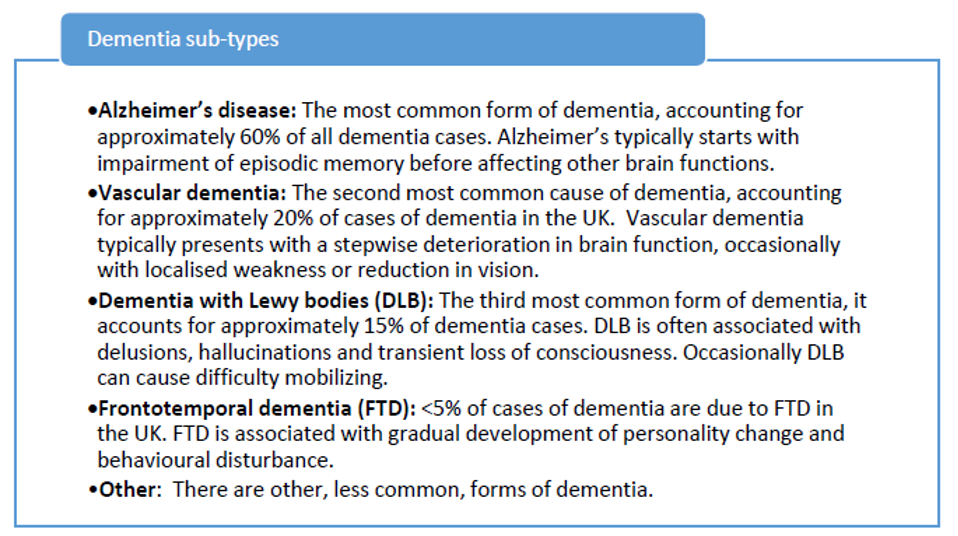
Dementia is an umbrella term used to describe a range of progressive neurological disorders (conditions that affect the brain). Although there are many subtypes of Dementia, the five most common are: Alzheimer’s Disease, Vascular Dementia, Dementia with Lewy Bodies, Frontotemporal Dementia, and Mixed Dementia. Some people may have a combination of different types of Dementia, and these are commonly called mixed Dementia 21.
Although often thought of as a disease of older people, around 5% of people with Alzheimer’s Disease are under 65. This is called early-onset or young-onset Alzheimer’s and usually affects people in their 40s, 50s and early 60s, with around 5% of people with Alzheimer’s Disease under 65 22. Early onset Dementia is caused by generally similar diseases to Dementia in older people (known as ‘late-onset Dementia’), but there are differences to note. There is a wider range of diseases that cause Young-onset Dementia, and a younger person is much more likely to have a rarer form of Dementia. Alzheimer’s is the most common cause of early-onset Dementia. However, there are other causes in younger people, such as Frontotemporal Dementia (FTD) and much rarer causes such as Huntington’s Disease and Creutzfeldt-Jakob Disease (CJD) 23. A person with Young-onset Dementia may experience different symptoms from the memory loss usually associated with Dementia in older people. They could have, for example, problems with behaviour, vision, or language.
There is no cure for Dementia and the progressive deterioration that it causes results in high morbidity and, invariably, an earlier death for those afflicted with it.
7.2 Causes of Dementia
Dementia is not a single disease but is a term used to describe the symptoms that occur when there is a decline in brain function 24. As mentioned above, several different diseases can cause dementia (the figure below). Many of these diseases, such as in Alzheimer’s, are associated with an abnormal build-up of proteins in the brain. This build-up causes nerve cells to function less well and ultimately die. As the nerve cells die, different areas of the brain shrink. In vascular dementia, If the oxygen supply to the brain is reduced because of narrowing or blockage of blood vessels, some brain cells become damaged or die. In Dementia with Lewy Bodies tiny abnormal structures (Lewy Bodies) form inside brain cells. They disrupt the chemistry of the brain and lead to the death of brain cells 25.
 Source: Dementia - NICE
CKS
Source: Dementia - NICE
CKS
7.3 Dementia in the UK
Dementia is associated with complex needs and, in the later stages of the condition, with high levels of dependency and morbidity and therefore is one of the major causes of disability and dependency among older people worldwide. This is the case not only for the people who have the condition, but also challenges for their carers and families.
In England and Wales, dementia accounts for every 1 in 8 deaths 26 making it the leading cause of death nationally. In 2018 it was estimated that there were around 850,000 people living with dementia, with this number expected to rise to over 1.6 million by 2040 27. Dementia therefore represents a significant current and, even greater, future challenge for all aspects of our society, with its effects being felt throughout not only the health and social care system, but also within communities, families and by individuals and their carers.
A national study 28 suggested that almost 7 in 10 people with dementia also have one or more other health condition. It reports that patients with dementia are more likely to have multiple health conditions. A total of 22% live with 3 or more comorbidities and 8% live with 4 or more comorbidities, compared to 11% and 3% respectively in the all-patient group.
The impact of dementia on health and wellbeing is significant and is progressively negative. The Alzheimer’s Society have reported that people fear Dementia more than any other disease 29. The loss of cognitive functions leads directly to reduced quality of life, increasing ill-health and early death for those living with the condition. A Dementia diagnosis, however, does not only impact the affected individual, but it also impacts their family, friends, work-colleagues, and the community; this impact can be physical, emotional, and financial.
Family and friends are often impacted through the need for provision of additional care and support for individuals with dementia, many take on the role of informal carers, carers that are not paid for their services. This results in additional personal strain for them but also loss of earning as they often must remain at home to care for their loved ones. Alzheimer Society estimates that the percentage of carers caring for more than 100 hours per week has increased from 40% to 50% since March 2020 30. In a wider context, Carers UK’s estimates that the average carer is now spending 65 hours a week on caring responsibilities 6[Behind Closed Doors, Carers UK (October 2020)].
The scale of the challenge that dementia poses to communities, local councils and national governments therefore is not to be underestimated, and it is for this reason that it has been identified as being the greatest global challenge for health and social care in the 21st Century 31.
7.4 Dementia Prevalence in Wandsworth
Dementia: Recorded prevalence (aged 65 years and over): In 2020, Wandsworth’s rate was 4.7% (n=1693), which was the 4th highest in London, 18.7% higher than the England average and 13.0% higher than the London average. The latest Borough figure for 2020 was also 4.5% higher than in 2017, in comparison with 8.3% decrease in England’s rate in the equivalent time period.
Source: OHID: Public Health Profiles
Source: OHID: Public Health Profiles
Estimated dementia diagnosis rate (aged 65 and older): In 2023, Wandsworth’s rate was 73.6 per 100 (n=1598), which was the 3rd highest in London, 16.8% higher than the England average and 12.2% higher than the London average. The latest Borough figure for 2023 was also 2.5% higher than in 2017, in comparison with 7.2% decrease in England’s rate in the equivalent time period.
Source: OHID: Public Health Profiles
Source: OHID: Public Health Profiles
7.5 Emergency Admissions Linked to Dementia
Dementia: Direct standardised rate of emergency admissions (aged 65 years and over): In 2019/20, Wandsworth’s rate was 4820.4 per 100,000 (n=1515), which was the 7th highest in London, 37.0% higher than the England average and 20.1% higher than the London average. The latest Borough figure for 2019/20 was also 13.9% higher than in 2016/17, in comparison with 4.5% increase in England’s rate in the equivalent time period.
Source: OHID: Public Health Profiles
Source: OHID: Public Health Profiles
7.7 National Policy Context for Dementia
Dementia is a national priority 32. There are many policy drivers for transforming dementia care, with a long-standing commitment in England to address dementia across all aspects of a dementia pathway; from pre-diagnosis to end of life care.
The first strategy of its kind, The National Dementia Strategy, ‘Living Well with Dementia’ (Department of Health, 2009) 33 was backed up by the Five Year Forward View, published in October 2014 34 which recognised dementia as a priority area. This further highlighted an aim to improve earlier diagnosis of dementia to slow the progression of the disease with treatment. To achieve this, the NHS Five Year Forward View focused on why there was a need for provision of a consistent standard of care for patients, improved support to clinicians and advisors and focus on proper care plans developed in partnership with patients and their families.
Following the publication of the Five Year Forward View, NHS England along with national partners launched a New Models of Care programme in 2015 35. The programme encouraged a more integrated care approach, which would present an opportunity to transform dementia care and support. Furthermore, the Next Steps NHS Five Year Forward update plan in 2017 36 focused on specifying what this integrated care model for dementia would look like within the established sub-regional Sustainability and Transformation Partnerships, as a mechanism to delivering the Five Year Forward Plan.
Building on the ambitions of both the National Dementia Strategy and the Five Year Forward View, the Department of Health’s Prime Minister’s Challenge on Dementia 2020, further highlighted the importance of good dementia care, describing the need to improve recognition and quality of care for people with dementia and support for their carers. This included challenges to improve public awareness of dementia, ensuring health and social care staff receive appropriate training for their role, ensuring continuity of care and that any care package is ‘meaningful’ after diagnosis, as well as improving public awareness and understanding of dementia. Emphasis was particularly made on the role of communities in the form of “Dementia Friendly Communities” and on Local Authorities’ engagement with Dementia Action Alliances. Prime Minister’s Challenge was further supported by a call to action across all aspects of dementia diagnosis, care, and support from Department of Health’s publication, ’Dementia: A State of The Nation Report on Dementia Care and Support in England 37.
The Prime Minister’s Challenge also highlighted the continued need to expand the evidence base investigating dementia treatment and prevention through increasing capacity for ahigh-quality research into these topics.
In 2014 the Care Quality Commission published their themed review of care for people with dementia, Cracks in the Pathway 38, as they move between care homes and hospitals. They highlighted that quality of care for people living with dementia varies greatly across England and raised a need for reducing such variability, ensuring that the personalised approach, knowledgeable staff, for people living with dementia is available throughout England’s health and care system.
NICE have also provided a range of guidance on dementia, including Quality Standards for Supporting People to Live Well with Dementia 39, guidance with recommendations for the identification, treatment, and care of people with dementia. NICE emphasized the principles of a person-centred approach 40; it also published a guidance covering mid-life approaches to delay or prevent the onset of dementia, disability, and frailty in later life, to increase the amount of time that people can be independent, healthy and active in late life 41.
There have been many other policies and guidelines in place to improve health and promote healthy behaviours within the population; however, it has not often been clearly stated that by improving individual’s health reduces the risk of dementia, disability, and frailty. Therefore, the role of Local Authorities was further highlighted by Public Health England (PHE) in 2018 which emphasised their critical role in reducing dementia risk as well as the overall societal impact through the promotion of healthy lifestyles, age and dementia friendly built environment approaches, maximising signposting opportunities and promoting opportunities to improve cardiovascular health through the “what’s good for your heart is good for your brain” campaign.
The NHS Long Term Plan 42 published in 2019, commits to further improving the care for people with dementia, with the aim to improve the care provision to people with dementia, whether in hospital or within the home setting. It re-emphasised the focus on dementia by including it in its “biggest killers and disablers of our population” list, with promotion of an increased focus on community multidisciplinary teams (MDTs) to provide care in the community to retain independence of people living with dementia.
7.8 Local Policy Context for Dementia
Although, there is no strategy specifically designed to address dementia needs in Wandsworth, there are multiple plans or policies in which Dementia and Dementia-related care are considered in the table below. Overall, the policy context in Wandsworth describes a recognition of people with dementia and their unpaid carers; in addition to acknowledging the need for improved service accessibility in the Borough, whether that be access to medical care, housing, or social activities.
7.9 The Economic Impact of Dementia in the UK
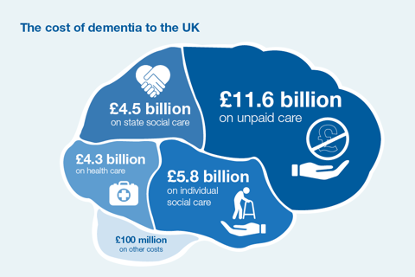
Annually, the direct healthcare cost of dementia in the UK is estimated to be approximately £26 billion, the equivalent of £32,250 per person per year. As expected, social care costs account for a significant portion with £5.8 billion being private funded by individuals (23% of total cost) and the rest, £4.5 billion by the state (the figure below). More than half of these costs, however, come from unpaid care, which is valued at £11.6 billion; however, this may well increase in future, as more people leave employment to undertake care activities. The cost of this early loss of employment is estimated to be around £3 billion by 2030 43.
Approximately 25% of hospital beds are occupied by people living with dementia. Their length of stay is often longer than of people without dementia; the delays in supporting people with dementia to leave hospital are also more frequent 44.
Source: Public Health England Guidance: Health matters: midlife approaches to reduce Dementia risk, 2016 45
7.10 Risk Factors for Dementia
The risk of developing dementia is associated with a mixture of factors–some which can be avoided (modifiable risk factors) and others that are virtually impossible to control (non-modifiable risk factors).
The risk of developing dementia can be affected by lifestyle, by genetics, vascular reasons or drug and medicine related 46. It is estimated that more than a quarter 28% of the British public cannot identify potential modifiable risk factors for dementia and only 2% could identify any of the following risk factors: heavy drinking, smoking, high blood pressure, depression, and diabetes as well as the protective factor of taking regular exercise. This is despite that 59% of people know someone with dementia 47.
Non-modifiable Risk Factors for Dementia
These are risk factors that as the name implies, cannot be changed as they are inherent in each person.
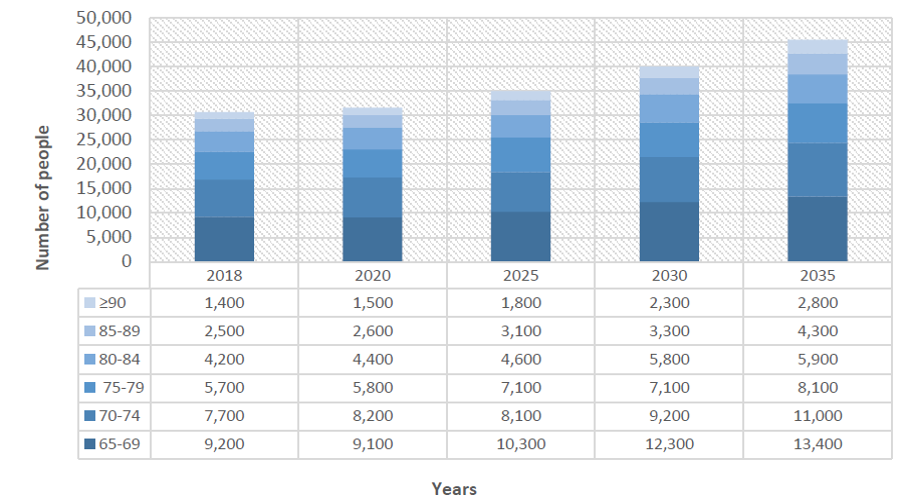
- Age: Age remains as the single biggest and non-modifiable risk factor for dementia with a person’s risk doubling approximately every 5 years 48 above the age of 65. In Wandsworth there are currently estimated to be 30,744 residents ≥65, accounting for 9.7% of the total Borough population. It is estimated that this number is to increase by 87% to 57,622 residents by 2050 (the figure below - up to 2035 only)
- Gender: Alzheimer’s disease is more common in women than men, even after accounting for the greater life expectancy in women. This association is not seen for other dementia types (e.g., vascular, LBD or FTD). This is reflected in Wandsworth where 62.6% (1,318) of dementia patients ≥65 are women, even though women make up 56% (17,500) of the total ≥65 population. In terms of a wider impact, women are far more likely than men to end up as carers of those with dementia. Women are also more likely to reduce their hours or stop working to care for someone with dementia, and some feel penalised at work for taking on care responsibilities
- Ethnicity: The Social Care Institute for Excellence (SCIE) have estimated that more than 25,000 older black and minority ethnic (BME) people live with dementia in the UK. Further research suggests that South Asian, African, or Afro-Caribbean ethnic groups have higher rates of dementia than other ethnicities 49 due to an increased rate is thought to be due to the higher prevalence of high blood pressure, diabetes, and strokes within these ethnic groups. This is particularly relevant in Wandsworth where 25.26% of the population identify as black, Asian and mixed ethnicity (BAME), based on the 2011 Census. In 2016, 40.7% of people, who died in Wandsworth with dementia being identified as the underlying cause, were born outside of the UK 50
- Other: Learning disabilities, particularly Down’s Syndrome, significantly increase the risk of developing dementia and earlier onset dementia. In 2016/17 there were 1,205 people, known to their GP, affected by learning disability in Wandsworth. People with Down’s Syndrome are most likely to develop dementia linked to Alzheimer’s disease. However, there is a growing awareness that people with Down’s Syndrome can also develop other forms of dementia 51
Source: Wandsworth Dementia Health Needs Assessment, 2019
Although there is no evidence to suggest that sexual orientation is a risk factor, the experiences of living with dementia in the lesbian ,gay, bisexual and transgender (LGBT) community need to be taken into consideration. LGBT communities are affected by dementia both as patients but also as unpaid carers. Using national prevalence rates for dementia it is estimated that 5–7% of the population is LGBT, thus over 34,000 LBGT people living with dementia nationally. The Alzheimer’s Society estimates that between 35,000 and 70,000 LGBT people care for a person with dementia in the UK. Therefore, people from this community face additional challenges in terms of getting appropriate support and understanding. This may be finding appropriate residential care in later stages of the disease or accessing Support Groups in early stages where other older people are comfortable discussing same sex partnerships. Estimates of the prevalence and incidence of gender dysphoria and transsexualism are difficult to quantify due to the lack of robust national data. It is accepted that gender dysphoria, if not treated, can severely affect a person’s quality of life and health status. High levels of depression are reported within trans communities, therefore indicate that this population group may require greater access to support. The Alzheimer’s Society consider that as dementia progresses a person may not recall their current gender and they may see themselves being pre-transition and be surprised at the physical changes to their bodies. It is therefore important that the specific needs of transgender Dementia patients are addressed appropriately. The Alzheimer’s Society provide advice on dealing with the impact of dementia on disclosure. Patients may have to make decisions on a day-to-day basis about whether to disclose their sexual orientation or gender identity–whether to be ‘out’. As dementia progresses, patients may lose their ability to make this decision. They may also be unable to stop themselves disclosing their orientation or gender identity by mistake.
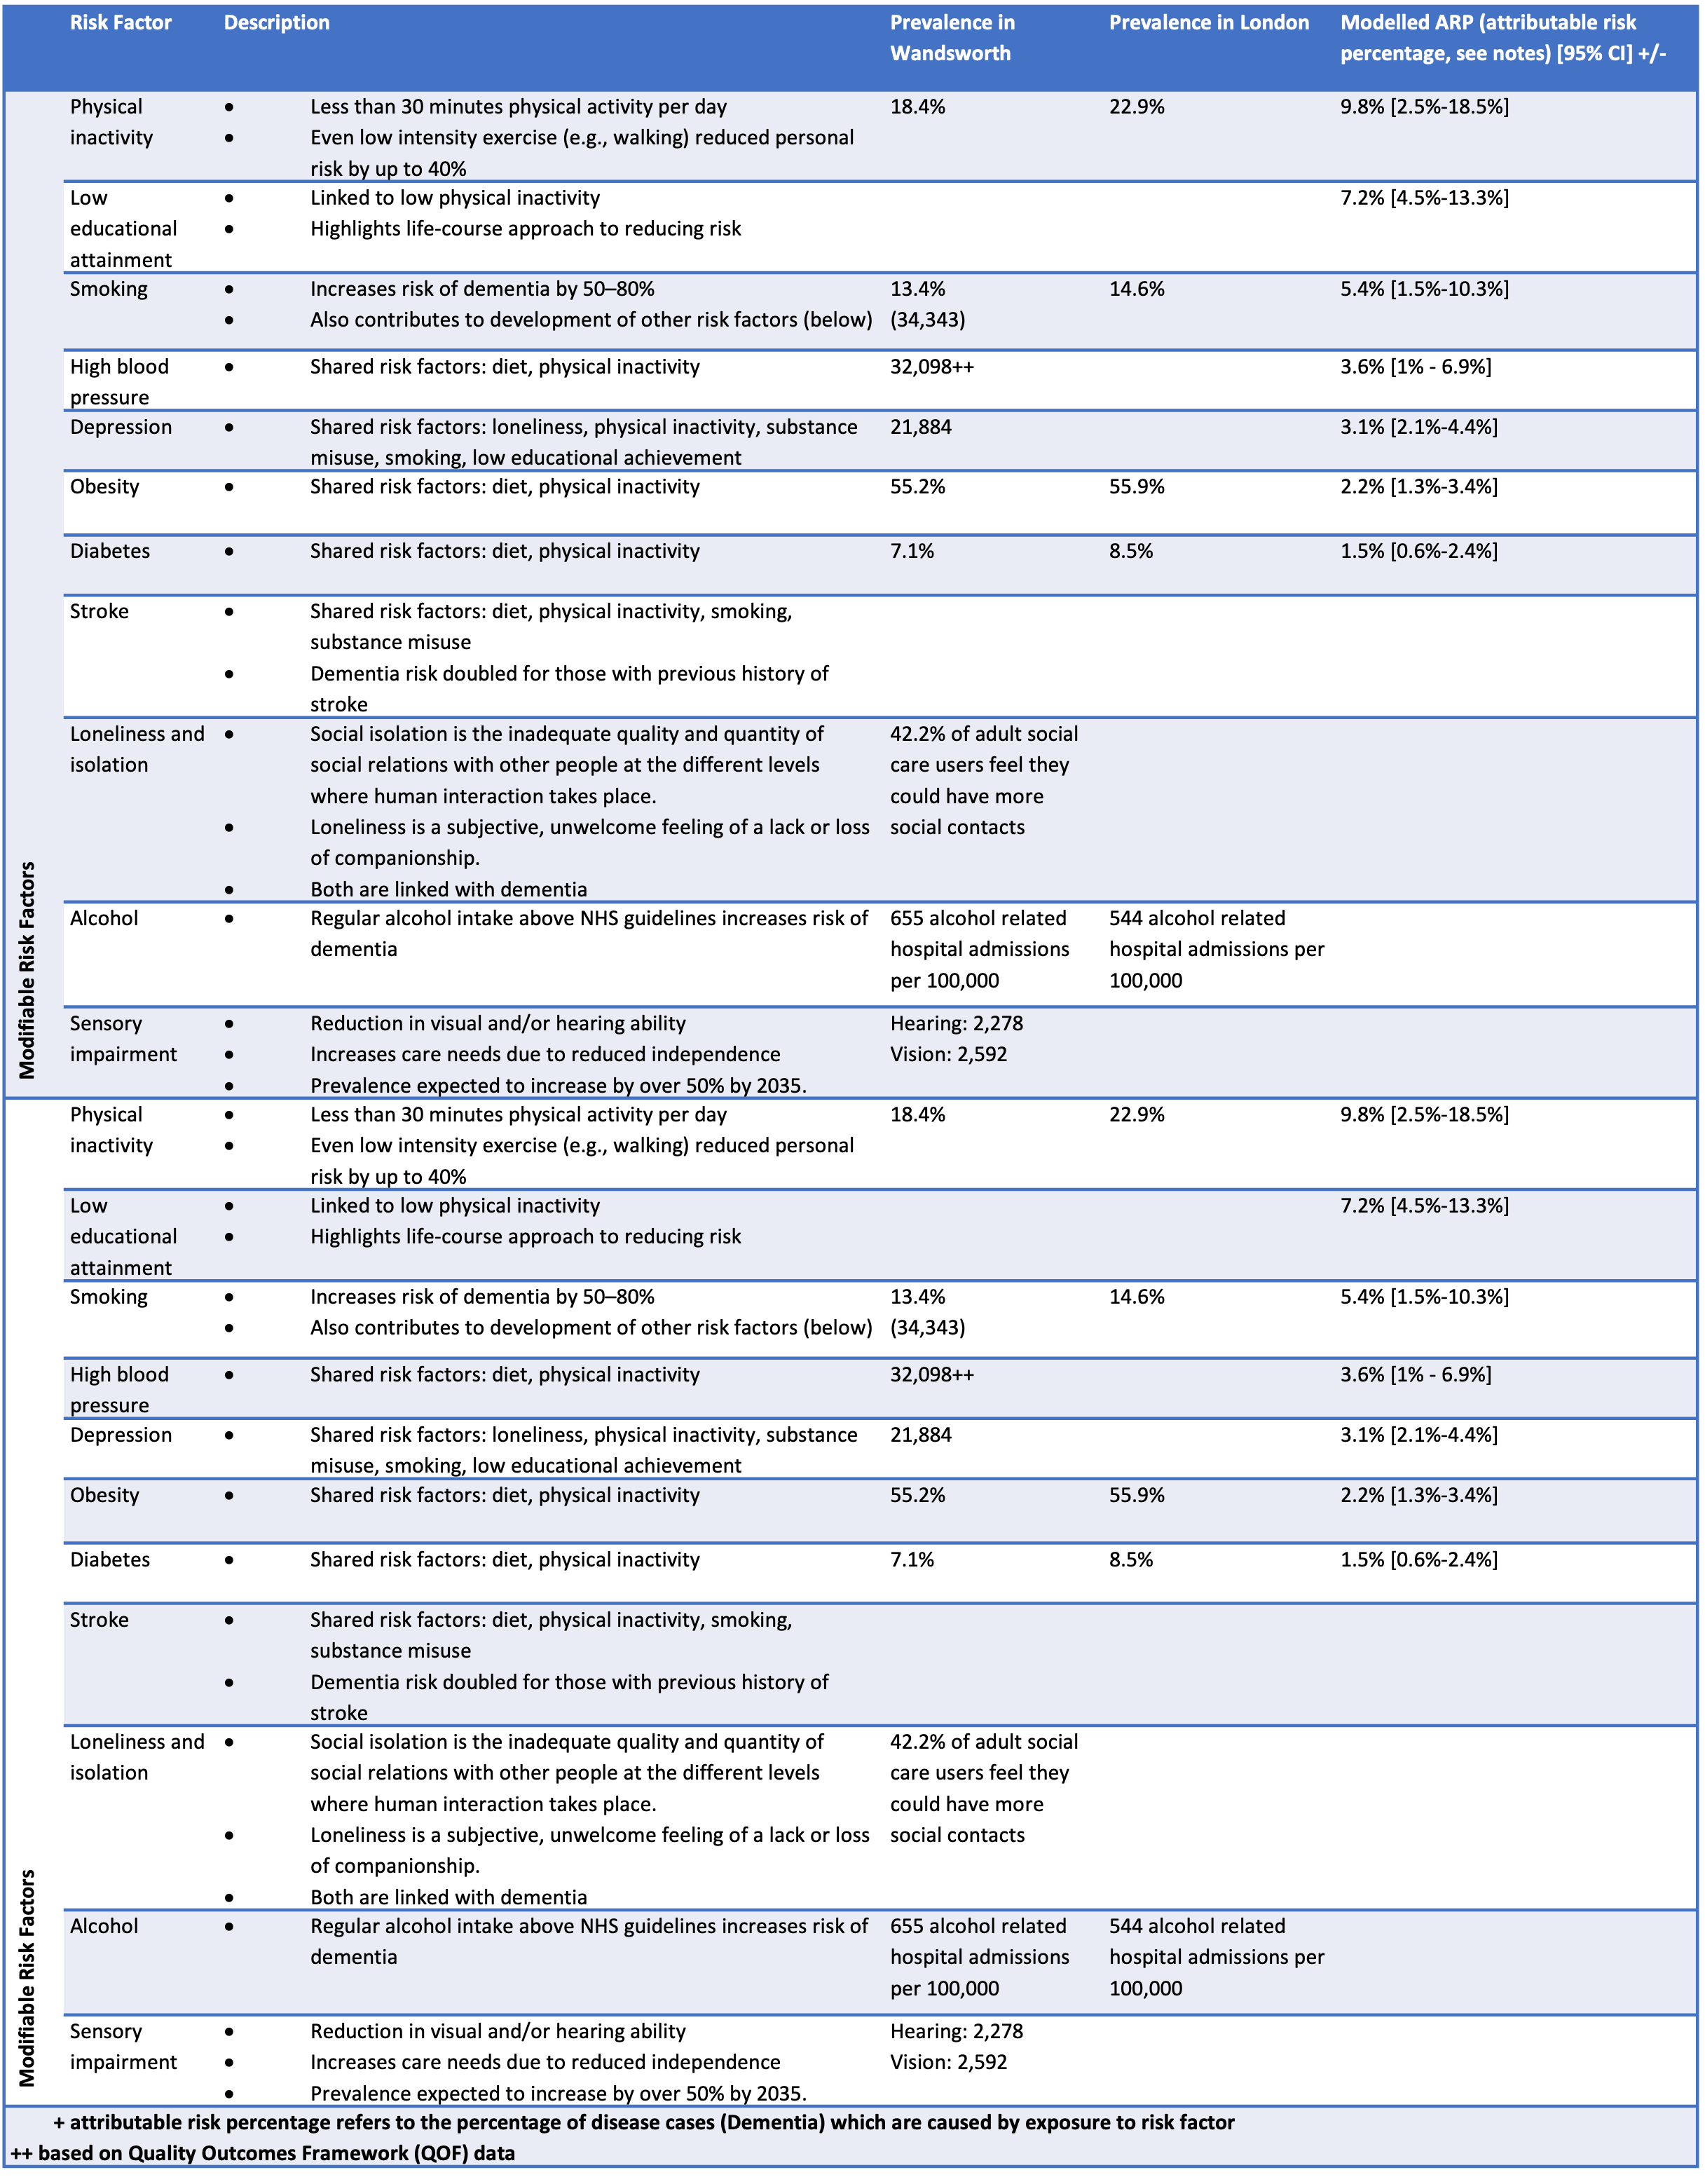
Modifiable Risk Factors for Dementia
There are also modifiable risk factors (the table below) of treatable medical conditions and lifestyle choices that play a role in developing dementia. These risk factors are partially in control of the individual, family, or community and, therefore, are the focus of many interventions. Recent studies have determined that improvements to lifestyle habits and management of comorbidities may lead to a lower risk of dementia. Management of cardiovascular risk factors (such as diabetes, obesity, smoking, and hypertension) and participation in regular physical activity, can reduce the risk of cognitive decline and may reduce the risk of dementia.
Health inequalities are exacerbated by the circumstances and environment in which we live, and often these health inequalities tend to persist into old age. There is a growing evidence that many of the modifiable risk factors for dementia are indirectly associated with socio-economic disparities in mortality and morbidity. For example, there is a strong link between cigarette smoking and socio-economic group 52. Smoking is one of the biggest modifiable risk factors for dementia doubling the risk of developing the condition. There is also evidence that low socio-economic position can result in lack of physical activity, another risk factor for developing dementia 53. The socio-economic circumstances can have a major effect on physical and mental health and can create or close off the opportunities to make healthy choices 54.
7.11 Evidence Based Interventions in Dementia
Dementia is currently incurable and the number of symptomatic treatments available are limited. However, dementia research is a key element of the Prime Minister’s challenge on dementia. PHE Dementia Intelligence Network is tasked with collating new and existing data on dementia enabling public health agencies to have a better understanding of prevalence and how it affects the population. Significant improvements were made over the recent decades in making more readily available treatment options; this as well as widespread dementia screening in routine assessments will result in a more ‘dementia-friendly’ clinical culture and society.
Both secondary and tertiary prevention strategies have benefits to those living with dementia, by slowing progression and improving quality of life; therefore, maintaining an individual’s independence for longer 55. The WHO published guidelines for the risk reduction of cognitive decline and dementia, whereby most of the recommendations align with current guidelines for the treatment of pre-existing health conditions and dependencies in the UK. For example, for cognitive outcomes in healthy adults, WHO identified physical activity interventions to have a positive effect on cognition and interventions for tobacco cessation may reduce the risk of cognitive decline and dementia, in addition to other health benefits. The report also recommends a healthy, balanced diet. However, much is still unknown about the long-term effect of treatment of older people and prevention through risk factor reduction 56.
Further evidence of good practice can be drawn from a Good Practice Compendium (2011) 57, which demonstrates how local delivery of the National Dementia Strategy can be supported, to improve outcomes for people with dementia and their carers. Similar content can be found in recent Alzheimer’s Society report published October 2020 58. Some of the evidence-based recommendations are included below, across the whole dementia journey.
7.12 Preventing Dementia
NICE recommends that national organisations and any local government department that influence public health, should develop and support initiatives to reduce the risk of dementia. Prevention and slowing of progress remain the mainstay of dementia management. A range of interventions have been suggested to be useful in supporting people with dementia to slow the progression of the disease and maintain their independence for longer 59 through promoting healthy lifestyles. These include encouraging healthy behaviours (reducing smoking, increasing physical activity, reduce alcohol intake), achieving and maintaining a healthy weight and adopting a healthy diet.
Prevention is better than cure and in dementia more so than in other disorders does this ring true. Although, we cannot influence the most significant risk factor (age), key interventions aimed at influencing and reducing cardiovascular risk, improving physical and mental health, addressing social isolation and loneliness 60 and combating drug and alcohol abuse are important avenues in dementia prevention. The Blackfriars consensus published in 2014 61 acknowledged that sufficient evidence exists, with which people can be empowered to reduce their risk of dementia through reduction of cardiovascular disease risk and improving brain health. In addition, there is evidence that stimulating cognitive functions throughout the life cycle is associated with reduced risk of dementia 62. Cognitive stimulation therapy (CST) is a brief treatment for people with mild to moderate dementia involves taking part in group activities and exercises designed to improve memory and problem-solving skills.
7.13 Diagnosing Dementia
Referral to dementia specialist diagnostic services ensures that a diagnosis is both timely and accurate. Different types of dementia can be identified quickly to ensure targeted and tailored support is in place in a timely manner. Memory Assessment Services (MAS) are recommended by NICE guidance43 as a single point of referral for early diagnosis of dementia. They can be provided in several different settings, including a psychiatric or general hospital, as part of community mental health services or in primary care. This single point of access can then act as a lever for further investigation of dementia sub-types.
Support Following a Diagnosis of Dementia
The Department of Health published guidance on what to expect from health and care services for those who are recently diagnosed with dementia, outlining the different stages of support a person and their carer may require; it is also a good building block for identifying what is good practice 63. NICE guidance indicates that service provision should ensure that people living with dementia have ‘equivalent access to diagnosis, treatment and care services for co-morbidities to people who do not have dementia’. There is associated NICE guidelines on multi morbidity 64 and older people with social care needs and multiple long-term conditions 65.
Care Planning
The use of care plans is recognised by NICE as a method of empowering patients to maintain their own independence following a diagnosis and is particularly relevant in Wandsworth, given that there is large variation in meeting care planning QOF targets; with performance of GP practices ranging from 66.7% to over 90%. Care plans should be drawn up and reviewed annually in face-to-face meetings with GP’s and should consist of the following core “D.E.M.E.N.T.I.A” components 66:
- Diagnosis Review
- Effective support for Carers Review
- Medication Review
- Evaluate risk
- New symptoms enquiry
- Treatment and Support
- Individuality
- Advance Care Planning.
Hospital Care
The NICE guidance on Dementia also addresses the transition from hospital to community settings (be it at home, or a care home setting) for adults with social care needs, which include the quality-of-care people should expect when they are admitted and discharged from hospital. This includes involving people in their own care planning.
An example of good practice within the hospital setting is having a multidisciplinary team that links directly with community services, to avoid unnecessary admissions. This drives a ‘home first’ approach, based on recognising that patients, being in their familiar environment whenever possible, optimises patient recovery and delivers better outcomes. One example of this is the ‘therapy at the front door’ initiative, which is a tactic that brings therapists into Accident and Emergency. Senior therapists identify and assess patients with frailty, who can then be discharged on the same day or may only require a short admission. By carrying out a risk assessment, they can immediately arrange rapid support to keep the patient safely at home.
Non-pharmacological Support
Non-pharmacological techniques, such as cognitive stimulation therapy (CST) and cognitive behavioural therapy (CBT) are also offered to dementia patients. CST is recommended by NICE for mild to moderate dementia whereas CBT is often used for those who are also experiencing depression and anxiety.
Pharmacological Interventions
The mainstay of treatment for dementia is improving quality of life and maintaining independence for as long as possible. For some forms of dementia, pharmacological (medication) is available in the early stages. A range of pharmacological interventions have been linked to support treatment and prevention of cognitive and behavioural conditions related to dementia 68. Dementia treatment options remain limited, with known dementia treatments diminishing in efficacy after the first few years.
7.14 Ensuring Quality of Life with Dementia
There is a wealth of evidence of good practices in provision of support and care for people with dementia and their carers to maintain independence for as long as possible. The following are examples of interventions to promote cognition, independence, and wellbeing:
Dementia Friendly Communities and Organisations
Dementia Friendly Communities (DFC) and Dementia Friendly Organisations (DFO) have become widely accepted in local and national policy as playing an important role in improving the lives of people with dementia. In 2014 Public Health England (PHE) and Alzheimer’s Society launched a major campaign promoting Dementia Friends [URL: www.gov.uk/government/news/new-Dementia-campaign-launches-as-research-reveals-the-true-cost-to-business-of-Dementia].
The Alzheimer’s Society defines a DFC as: “a city, town or village where people with dementia are understood, respected and supported, and confident they can contribute to community life. In a dementia friendly community people will be aware of and understand dementia, and people with dementia will feel included and involved, and have choice and control over their day-to-day lives” 69.
Both the LGA 70 and The Alzheimer’s Society have also published criteria and guidance on what should constitute a Dementia Friendly Community or Dementia Friendly Organisation and best practice. Criteria include good access to community services, such as befriending and engagement services and adjusting the practicalities of daily life, such as housing, travel, and local businesses to be dementia aware, responsive, and respectful.
The Kings Fund, as part of their Enhancing the Healing Environment series, have published self-assessment tools in 2014 and updated in 2020 for housing, care-homes, health centres and hospitals (the figure below). The tool assesses 7 domains, providing a score, which reflects the “friendliness” of the setting to those with dementia. The care home assessment tool 71 is particularly relevant to Wandsworth, as CQC findings report that nearly half of care homes in Wandsworth require improvements 72.
Source: The Kings Fund ‘Is your care home Dementia friendly?’: EHE Environmental Assessment Tool Domains. 2020 (redesigned)
Dementia Champions
Championing the dementia cause is needed across a range of settings. Skilling up staff through dementia awareness training on the signs and symptoms of dementia can contribute to staff becoming more responsive to dementia needs, lead them to a better understanding of the issues related to the disease and championing the dementia agenda.
Peer Support and Dementia Cafes
Research shows that people with dementia express is the need to stay connected to their families, friends and communities and be able to engage in activities that they enjoy. Unfortunately, some community groups find it difficult to accommodate people with dementia.
The National Dementia Strategy promotes the establishment and maintenance of local peer support networks for people with dementia and their carers. These types of initiatives 73 are also supported by the Prime Minster challenge37. Furthermore, the Care Act 2014 ^[[GOV.UK. Care Act 2014. URL: http://www.legislation.gov.uk/ukpga/2014/23/contents/enacted] stipulates that improvements are required in delivering early interventions from care and support systems to support individuals to retain or regain both their skills and confidence, and to prevent or delay deterioration wherever possible. Additionally, NICE guidance recommends people are signposted to support groups post-diagnosis and their carers have access to peer support opportunities. The Health Innovation Network produced a resource pack to bring together examples of good practice and evidence-based guidance on peer support, to help groups and organisations better support people with dementia in their communities.
Assisted Technology
There has been a great deal of promise in how assisted technology, ‘electronic’ or ‘intelligent’ assistive technology, may help address the individual, family and societal challenges presented by dementia, and to support people with dementia to live more independently and, ideally, with improved quality of life in a cost-effective way. The challenge is that there is no real evidence available that can confirm such claims and more robust evaluations helping to understand what works, for whom and how are needed as well as the impact of these technologies in the context of dementia 74 75.
Supporting Carers
Carers of people with dementia face additional challenges to ensure that their own physical and mental health needs are being recognised and met, both because of the demands of the caring role, but also because of difficulties with accessing support. It is essential that carers have good support to enable them to manage the stresses and demands of their caregiving. NICE guidelines recommend that services make provision for carers to be supported in their roles 76. Informal carers are particularly important, given the significant contribution they make to the people they care for but also to the community. Nevertheless, informal carers are also at risk of personal psychological and psychosocial distress, which must be monitored, identified, and managed promptly. Evidence of good practice in supporting carers include offering education and skills training to carers. Some carers may require their own care plans to address their needs too, which can include, but not be limited to, psychological therapies (e.g., CBT), peer-support groups, training courses and respite care.
7.15 End of Life Care and Dementia
People with dementia have the same right to a good death as people with other health conditions. The Department of Health (2008) indicates that a good death would involve being treated as an individual, with dignity and respect, without pain and other symptoms, in familiar surroundings and in the company of close family and friends. However, it has been reported that often, people with dementia do not receive this level of dignified care and treatment, resulting in people with dementia not being referred for specialist end of life care, receive inappropriate treatment and, in some cases, ending their lives in pain 77.
There are quality standards that cover the clinical care of adults (aged 18 and over) who are dying, both during the last 12 months of their life 78, and during the last 2 to 3 days of life 79, which are supported by The Alzheimer’s Society that advocate a need for advance planning for end of life care, with improvements needed in the co-ordination of a good death, ensuring that health and social care professionals are trained in providing high-quality, person-centred care to improve dignity and quality of life, even when communication has declined.
The digital care planning service ‘Coordinate My Care’ (CMC), facilitates electronic sharing of urgent care plans between healthcare providers, including the London Ambulance Service (LAS) to enable sharing of core information such as preferred place of death, cardiopulmonary resuscitation status, advice regarding ceilings of care and other patient preferences.
7.16 Community and Stakeholder Views on Dementia
On a national level, the Dementia Attitudes Survey carried out by Ipsos MORI for Alzheimer’s Society 80 shows that, despite public awareness of dementia being relatively high, the range of symptoms of dementia are not as fully understood by the public, which has also very limited knowledge of the breadth of people, who are affected by dementia. There is a general misconception of dementia being a condition of old age rather than a cause of death, as well as a low level of understanding of risk factors that affect dementia. This contributes to a reduced recognition of ‘physical contributors to dementia risk compared to factors like less mental activity, loneliness, depression and stress’. The survey also identifies that the public want to know more about their brain health, especially within the younger and mid-life generation, to plan for future support and care.
There is public support for research into cure and prevention more so than research on improving quality of life for those affected with dementia, which demonstrates an appetite for increased knowledge on preventative action. The Dementia Attitudes Survey 81 also highlighted the importance of culturally sensitive messaging and support in future campaigns that should be informed by input from BAME communities.
7.17 Prioritising Dementia in Wandsworth
The 2019 Dementia Needs Assessment found that five years ago, the dementia prevalence in Wandsworth was lower than both regional and national averages. However, due to a high local incidence rate, prevalence in the Borough is increasing faster than elsewhere.
There are 12.6 new diagnoses of dementia per 1,000 people aged >65 per year in Wandsworth each year, a significantly higher rate than the London (10.3 per 1,000) and England (11.1 per 1,000) average 82.
As of January 2019, 1,719 people aged over 65 on Wandsworth GP registers had a diagnosis of dementia, accounting for 5.4% of the total Wandsworth ≥65’s population. This figure climbs to 2,158 (6.8% of the ≥65’s population) if estimates of those living with undiagnosed dementia are added. There was a total of 1,774 patients (including under 65) with a diagnosis of dementia 83.
Based on these prevalence figures and 2012/13 average dementia care cost prices, the total cost of dementia in 2019 for Wandsworth is estimated as £70.4m, of which £27.3m is attributable to social care and £11.6m to healthcare costs. Importantly, given that there is expected to be a 47% increase in the number of people aged ≥65yrs affected by dementia by 2035, the costs associated with care for this cohort of patients is likely rise more steeply. There is also a wider system pressure on activity and finances; for example, Wandsworth has a falls history recorded for 42% of patients of the memory clinic, indicating an additional pressure on health and care resource, time, and expertise across the wider system.
One of the reasons that Wandsworth Borough Council considers dementia a priority is because the rate of increase can be decreased with effective reductions in dementia risk factors; with current evidence suggesting that up to 30% of the most common forms of dementia can be prevented or delayed simply by addressing these risk factors. A delay of 2 years in dementia onset can result in a 22% reduction in costs by 2050 with a 5-year delay resulting in a 36% reduction in costs 84.
Additionally, slowing dementia progression also reduces the severity of disease for patients. Compared to baseline (normal progression) a delay in dementia progression by 25% would reduce the number of severe dementia cases in 2050 by approximately 43%, whereas a 50% slower rate of disease progression would reduce this by approximately 86%.
Early Onset Dementia
Amongst those aged under 65 on Wandsworth practice registers, dementia prevalence is 1.58 per 10,000. (n=58). This is significantly lower than prevalence in London (2.28 per 10,000) and England (3.41 per 10,000). Dementia affecting those under 65 years accounts for 3.3% of dementia cases in the Borough.
Dementia and Ethnicity
Regarding recorded dementia diagnosis by ethnicity, the data may not be as accurate, as many ethnicities have not been defined in reporting. For example, in Wandsworth, as of January 2019, 238 of dementia patients had their ethnicity recorded as white, 139 as Asian or Asian British, 41 of mixed or multiple ethnic groups, and 16 defined as ‘other’ ethnic group. No ethnic reporting was recorded for Black or African or Caribbean or Black British, however, most of the reporting did not define ethnicity (n= 1191). Therefore over 70% of people with a diagnosis of dementia in the Borough of Wandsworth do not have their ethnicity recorded. Consequently, whilst these figures may rationalize further investigation, they should be interpreted with extreme caution.
Referrals for the Memory Assessment Service (MAS) also records ethnicity when agreed or provided by the service user, but again, these figures should be interpreted with caution. The current MAS caseload as of May 2020 reported 45.6% as White 17% as Asian, 1% mixed or multiple ethnic groups, 3.7% as ‘other’ and 12.4% recorded Black or African or Caribbean or Black British. 18.2% did not answer and 1% left the answer blank. As data on the Borough ethnicity is as it was in 2011, it is difficult to draw conclusions about any discrepancy between expected and actual referrals for the BAME community to the MAS clinic, as this data would not be relevant to the existing dementia referrals as of 2020. The MAS caseload data was included in the national census, March 2021.
Dementia in Relation to Comorbidities
Rather than being the primary reason for emergency admissions, dementia is most often a secondary or tertiary diagnosis in Wandsworth, emphasizing dementia’s relationship to comorbidities . Although there is inconsistent primary care provision within care homes, there are dementia specialist nurses available in the Borough to support the recognition of mismanaged comorbidities.
Geographic Variation
Due to differences in population size and case finding practices between GP’s, obtaining accurate data regarding the geographic prevalence of dementia diagnoses is difficult. Nevertheless, some over-arching themes have been identified through triangulation of data from Primary Care, Adult Social Care (ASC) Services and ward demographic profiles.
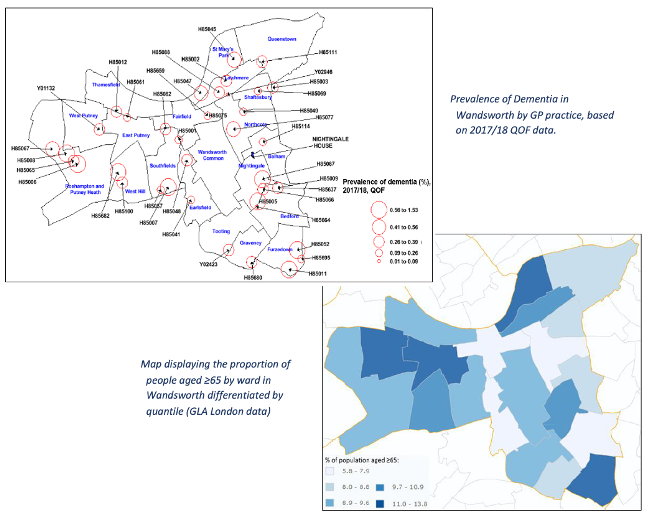
Generally, dementia prevalence is higher in southern and western wards of the Borough, reflecting the higher proportion of ≥65 residents who live in those areas. Wards such as Nightingale and Furzedown in the South, and West Putney and Roehampton and Putney Heath in the west all having relatively high prevalence rates. Of note, is that Nightingale has the highest prevalence of dementia out of all London wards at 1.5%, which is linked to having a number of care homes located in the area (the figure below). The size of this intra-borough variation, in both disease prevalence and risk factor prevalence, highlights the importance of considering geographic location when allocating resources related to dementia.
Residential Status of Dementia Patients
Having dementia does not mean that people cannot live independently. Dementia UK estimates that 63.5% of people with late onset dementia live in their own home. Local data from 2017/18 showed that 80% of ASC users with a documented dementia diagnosis lived in the community, a reduction from 89% from the previous year 85.
Estimates based on the expected dementia prevalence in these care settings suggests that Wandsworth residential homes and nursing homes have 259 and 179 residents respectively who are living with dementia which is either unrecorded for ASC purposes, or undiagnosed. This highlights a need for either improved completeness of data collection, or for improved access to diagnostic services in care homes in the Borough, or both.
754 people received Wandsworth Adult Social Care Services in 2017/18, of whom only 6% (45) had dementia documented in their MOSAIC record, this is lower than national and expected figures 86. A total of 479 people were in residential accommodation, 277 of them are estimated to be living with dementia but only 18 had a dementia diagnosis recorded on MOSIAC. This leaves a gap of 259 unaccounted cases (Diagnosis rate = 6.5%). In nursing accommodation, of 275 residents, 201 were estimated to be living with dementia but only 27 had a dementia diagnosis recorded on MOSAIC, leaving a gap of 174 counted cases (Diagnosis rate = 13.4%).
The low dementia diagnosis rate in care homes in Wandsworth may have previously been attributable to the reduced attention to non-urgent conditions in the context of large homes using weekly (or less frequent) primary care ward rounds. The low diagnosis rate in Wandsworth could also be due to inconsistent documentation of confirmed diagnoses in the social care system, rather than a true diagnostic gap and this needs further exploration.
Emergency Admissions
Although not usually a primary reason for admission, dementia is often a secondary or contributing factor in unplanned hospital admissions amongst the elderly. The increasing numbers of people with dementia living longer has resulted in a significantly higher likelihood that they will require care in acute hospitals.
In 2016/17, Wandsworth’s standard annual rate of emergency admissions to hospital for those ≥65 with dementia was 4,299 per 100,000 people, significantly higher than both London (4,052 per 100,000) and England (3,482 per 100,000) figures.
The number of admissions has also been steadily increasing since 2013/14 (the figure below). Across the whole of South London, Wandsworth has the highest ratio of London Ambulance Service (LAS) call-out to conveyance rates (i.e., the proportion of ambulance call outs that result in a hospital transfer) relative to the number of care beds. Of these admissions, 30.5% last less than 1 day, similar to the London average (28.9%), suggesting that the extent of illness is similar on presentation.
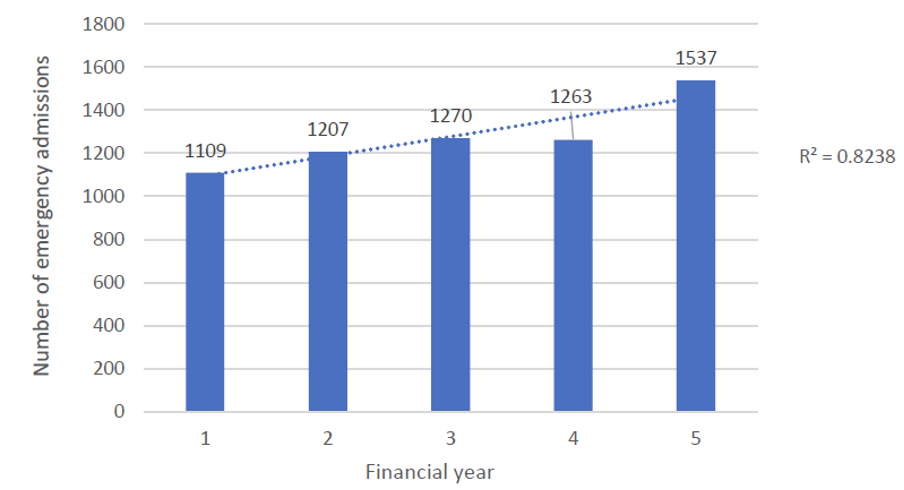
Source: Wandsworth HNA 2019
The Wandsworth Dementia HNA reported that there are many possible underlying causes which may be responsible for the increasing trend in dementia related emergency admissions, including increased dementia prevalence, reduced quality of formal dementia care and/or reduced informal care capacity, amongst others. One finding, suggested inadequate care quality may be responsible for this trend, given the highest LAS call out to conveyance rates relative to the number of care beds mentioned above. This is consistent with CQC findings that nearly half of care homes in Wandsworth require improvements 87.
One of the aims of the NHS Long Term Plan was to help prevent unnecessary hospital admissions by providing great healthcare closer to home and this highlights a potential need to focus on improving the care provision at home/place of residence. One way that Wandsworth has tackled this is to provide a care home in-reach team who are able to target care homes with high call-out rates and who maintains a strong visual presence by attending regular GP rounds at the care homes as well as providing a rapid response function.
Use of Antipsychotic Drugs in Dementia Patients
The NICE Guideline on Dementia 88 includes managing non-cognitive symptoms of dementia such as agitation, aggression, distress, and psychosis. Antipsychotics (except for risperidone and haloperidol in some circumstances) are not routinely licensed in the UK for treating non-cognitive symptoms of dementia. NICE recommends discussing the benefits and harms with the person living with dementia and their family members or carers (as appropriate) before starting antipsychotics. NICE recommends that care providers should provide additional training and mentoring to staff who deliver care and support to people living with dementia including advice on interventions that reduce the need for antipsychotics and allow doses to be safely reduced.
As of January 2019, the total dementia register for the Wandsworth area was 545, with 18 of those on antipsychotic medication in the 6 weeks prior 89. Although this data cannot be used to directly compare different areas across London or across the country, it does seem to indicate a low level of antipsychotic medication prescribing and is an encouraging indication that there is use of non-pharmacologic methods to manage behavioural symptoms of dementia (distraction techniques, verbal de-escalation, structuring the daily activities) and resorting to medications as last chance.
Unpaid Carers for People with Dementia
Accessing social care and social support services is key to the well-being of people living with dementia and their carers. The present challenges include recognising the additional burden upon unpaid carers, to avoid carers neglecting their own health and wellbeing needs especially in COVID-19 times. Respite is the issue that has been particularly exacerbated by the pandemic.
In Wandsworth specifically even though many carer services are present the evidence of poor quality of life scores reported by Wandsworth carers in the Survey of Adult Carers suggest that these services are currently either under-utilised or inaccessible for some.
7.18 Limitations to the Dementia Data/Information
The data on many metrics for dementia care, particularly those related to equity of access, are limited. Consequently, it is not possible to achieve any conclusive insights into service equity in the Borough. Consideration of actions to resolve this are included in the Dementia HNA recommendations.
We currently do not have robust data on the actual number of dementia patients in Wandsworth with a disability, which is a substantial gap when considering planning services and their accessibility for people living with dementia.
Whilst there is comprehensive data available for older people, several data sets are unclear/ missing from current data provision. The HNA highlighted that the collection of data on sexual orientation and gender amongst Adult Social Care users is not sufficient to understand how needs related to sexual orientation and gender are distributed in the Borough in relation to dementia. Estimates of the prevalence and incidence of gender dysphoria and transsexualism are difficult to quantify due to the lack of robust national data. Estimates of the prevalence and incidence of gender dysphoria and transsexualism are difficult to quantify due to the lack of robust national data.
7.19 Dementia Services in Wandsworth
There is evidence of successfully implemented dementia care pathways, such as in Richmond and Lewisham, where both Local Authorities follow the life course of person-centred approach to dementia outlining the dementia services on offer. These priority phases include prevention, diagnosis, and care of dementia across a Dementia Pathway. They are described as preventing dementia, diagnosing dementia, supporting after a diagnosis of dementia, enabling a fulfilling life with dementia, and ensuring dignity and comfort for those dying with dementia, and it is with these phases that we can begin to map what is already happening in Wandsworth.
Preventing Dementia
There are many different exposures that can increase dementia risk. Consequently, dementia prevention can be considered as any activity which actively reduces these modifiable risks, whether it is explicitly designed with a focus on dementia or not. There is a provision of NHS Health Checks to people aged between 40 and 74 years old, which identifies potential modifiable risk factors, in addition to screening for dementia itself and signposting to services that could help reduce the risk of dementia in Wandsworth’s residents.
The Public Health team already have several interventions that can support work to deliver dementia awareness and training, in addition to the health checks programme. For example, ensuring that smoking cessation and diet improvement resources are readily available, reviewing new licensing applications to reduce alcohol-related risk, and provide advice on risk-reduction activities, such as smoking cessation and diet improvement. The needs of people with dementia will also be considered in any future prevention offer.
Diagnosing Dementia
In Wandsworth, the Dementia Pathway starts with the GP, who can arrange health services before and after diagnosis. The GPs refer to Memory Assessment Service (or MAS) to confirm the diagnosis. The memory assessment service is currently provided at the Springfield University Hospital and overseen by Consultant Psychiatrists. This is a specialist diagnostic service for people who are experiencing signs of memory and cognitive impairment. The service provides expertise around dementia investigations, diagnosis, and differential diagnosis. The MAS provide preliminary advice and support for people post diagnosis and refer on to other services, if appropriate. Anyone who uses the services is provided with an assessment of their mental health needs and a plan of the care and support they will receive. They will also have one named person who co-ordinates their care and support. This person will be called either a named professional or a care co-ordinator. It was previously the responsibility of primary care to annually review care plans, however, the Dementia Support Service now reviews the Dementia Collaborative Care Plans (DCCPs) undertaken by the Memory Assessment Service (with the patients` permission) and adjusts the support plan ensuring the person diagnosed with dementia and their carers have access to tailored support, information and advice that meets their needs.
The main purpose of MAS is to diagnose dementia and initiate treatment. If they are to do this effectively, they need to ensure that people with cognitive problems (but without dementia) get quick access to the interventions they need. Some patients present with memory concerns due to a range of non-dementia causes. The London Dementia Clinical Network have produced a guidance document 90 aimed at commissioners and clinicians within memory services and primary care to help patients get on the appropriate pathways for patients who present with memory complains due to a range of non-dementia causes, such as mild cognitive impairment (MCI) or functional cognitive disorder (FCD).
To address lower than national and expected figures 91 in Dementia diagnosis in care homes, all care homes have a clinical lead; this includes Older People’s care homes, nursing, residential, mental health and learning disability homes.
As part of the Enhanced Health in Care Homes (EHCH) model, from October 2020, support to care homes include the introduction of PCN 92 Care Home Clinical Lead, with weekly clinical review check-ins, virtual MDT meetings to and develop the personalised care plans within seven working days of admission to the care home, and seven working days of re-admission following a hospital episode. The PCN Care Home Clinical Leads were introduced alongside all other existing NHS services routinely accessible by the care home patients.
Care and Support After Diagnosis
The SWL CCG commissions the Dementia Support Service that commenced in April 2020. It provides systematic and proactive support to people and their carers/family, who are living in Wandsworth or are registered with a Wandsworth GP. This includes people with dementia living in a care home. This service works in close collaboration with health and social care and the voluntary sector and is a single point of access linking all dementia support in the Borough. The service delivers much of its activity off-site in service users and their carers’ homes.
The Dementia Support Service provides a holistic needs assessment to service users and their carers with the development and use of support plans, a range of information and advice services to both people living with dementia, families, their friends and carers, peer support, education and a range of social and leisure activities that improve wellbeing for people with dementia and their carers/families can easily access and face to face visits (at the time of writing, this has been suspended, and replaced by telephone to minimise the risk of spreading COVID 19).
Alzheimer’s Society’s personalised support service, Dementia Connect, is another service where Dementia Advisers can support people directly by phone or face to face and connect them to a range of local services, such as local support groups, help them to understand dementia and coping techniques, or even advice on Lasting Power of Attorney.
Enabling a Fulfilling Life with Dementia
Wandsworth Council currently offers a range of day opportunities for older people and people with physical and sensory disabilities. These include a mix of open access for all older people and specialist day services, including spot-purchased places, which support adults with assessed eligible needs under the Care Act 2014. Demand has increased for these services. The existing Wandsworth day services offer:
- Opportunities for social interaction to reduce isolation
- Training and skills development to support independence
- Provision of social and recreational activities
- Supported stimulating activities for those with multiple disabilities
- Personal and/or practical care to those unable to access the community independently
- Respite for carers.
Wandsworth Borough Council have a block contract with Four Seasons Healthcare for Holybourne Day Centre, a specialist dementia-specific day care service consisting of 139 places a week and some spot purchasing. The pre-requisite is that the adult has a pre-existing diagnosis of dementia. Gwyneth Morgan Day Centre currently provides low-level dementia. All other services are spot purchased based on individual need.
The Wandsworth Older People’s Community Mental Health Team also provide specialist support services as part of enabling a fulfilling life with Dementia. These are the Behaviour and Communication Support Service (BACSS) and the Community Behaviour and Communication Support Service (CBACSS). The BACSS is a specialist care home team supporting staff in caring for their residents who are experiencing behavioural and emotional difficulties associated with a mental health diagnosis and/or dementia. The team offers innovative and multidisciplinary care and also have an active role in teaching and training staff teams in person centred care. The CBACSS is a specialist service to support people with dementia who are experiencing behavioural and psychological symptoms of Dementia (BPSD) at a level that is challenging and significant. The service offers a multidisciplinary and whole systems approach, aiming to help families to live well with dementia in the community.
Ensuring Dignity and Comfort for Those Dying with Dementia
There is a Wandsworth End of Life Care Co-ordination service, which organises the delivery of end-of-life care from various health and social care providers, facilitates communications between the various agencies involved and is also able to create a care plan to guide the out of hours services.
Most of the palliative care in Wandsworth is provided by Royal Trinity Hospice (RTH). The RTH community team, consists of three registered nurses who visit people in their place of residence. Within the hospice building, there is a dementia friendly bay and staff are trained as dementia friends. From 2200-0700 hours, Marie Curie Nurses and Healthcare Assistants are available to care for patients with end-of-life care needs and provide vital support for their carer and families.
A nationwide tool to improve end of life care is Coordinate My Care (CMC). This is an IT resource on which the needs and wishes of people with various medical conditions are logged. 91% of those who have a CMC record in Wandsworth have their preferences related to death recorded (i.e., preferred place of death). Data taken from the CMC database of care plans created between April 2018 and March 2019 for care home residents in South West London, showed that for every 100 residents there were 20 CMC care plans created. Wandsworth had the highest rate of records created, with 33 to every 100 residents 93.
The table below lists main local services that can be accessed to reduce the risk of dementia.

The following table lists services currently available to dementia patients and their carers.

7.20 Improvement Opportunities in Dementia Prevention and Care
The management and reduction of dementia risk factors with population-level initiatives, particularly targeted at mid-life age groups, is recommended by NICE clinical guidance (NG16) and the subsequent improvements opportunities in Wandsworth are outlined in the table below.

The improvements with regards to patients already with Dementia and for carers of people with Dementia were also assessed against NICE guideline 97 and framed around the principles of person-centred care in the context of Dementia, as described in the table below.

8. End of Life Care
8.1 Understanding End of Life Care
Death is inevitable and a guaranteed part of life. It affects not only the individual concerned, but also the person’s family, friends, and their community. In the context of an expected death, as result of aging or disease when, and where someone dies can be influenced, in line with the national and local policies and practices. Optimising the clinical and social care offer is part of the policy drivers. It must be noted that service improvement and transformation can facilitate a more peaceful, or perhaps more positive, experience for an individual and their loved ones. End of Life Care as a theme needs to be recognised and celebrated in a similar manner to when a baby is born.
Around 500,000 people die in England every year with approximately 1,500 being Wandsworth residents . More than 50% of these deaths are caused by cancers, circulatory and respiratory diseases, with circulatory disease in particular playing a larger role in Wandsworth than nationally. The majority of these deaths, both nationally and locally, occur in hospital, although national data shows that most patients would prefer to die at home 94.
National evidence suggests that those with long-term conditions and older people are more likely to experience lower quality of care, and that the presence of comorbidities also increases the complexity of care needs at the end of their life. Due to the increasing numbers of people requiring this care, in part due to the ageing population from the ‘baby boomer era’ after the Second World War, thinking about health and care needs of the ageing population has become a national priority. The focus has also moved towards equipping local communities and voluntary sector organisations with resources to support this process.
It should be noted that death is not only a feature of ageing or illness, as it can happen at any point in the human life-course. Often death happens without notice, referred to as a ‘sudden and unexpected’ death, where an investigation by the police and/or a coroner may be required to establish causes, especially if a medical doctor is unable to issue a Medical Certificate of the Cause of Death 95.
Some elements of death in relation to drugs and alcohol, suicide and infectious diseases are covered in their respective chapters. Overlaps within other parts of the JSNA are also referenced herein, such as the terminal illnesses usually leading to plannable deaths e.g., dementia, cancer, circulatory disease, respiratory disease, community voice, amongst others.
This Wandsworth JSNA subsection refers to people with imminent deaths as a result of disease or ageing, which can be planned for, where End of Life Care as treatment and/or care can be put in place to support the person. Sudden and expected deaths, where there is an inability to plan for them, are not included.
8.2 Definitions and Scope of End-of-Life Care
End of Life Care is defined by Marie Curie specifically as the “treatment, care and support for people nearing the end of their life” 96, and is provided for those who are expected to be living in their last year, although this not always predictable and may only be provided in last weeks or days of someone’s life (ibid).
The General Medical Council (GMC) clarifies patients needing End of Life Care as being those with one or more of the following:
- advanced, progressive, incurable conditions
- general frailty and co-existing conditions that mean they are expected to die within 12 months
- existing conditions if they are at risk of dying from a sudden acute crisis in their condition
- life-threatening acute conditions caused by sudden catastrophic events” 97.
End of Life Care supports a patient, their family and friends from a terminal diagnosis, through to bereavement and may include medical, psychological, social, spiritual and practical support. Types of support include:
- Managing a patient’s physical symptoms, including pain management
- Providing emotional support for the patient and their friends and family
- Discussing and agreeing on a patient’s expectations, wants and wishes
- Providing practical support to make a Will or gaining financial support
- Enabling the last few days, months or year(s) to be as comfortable as possible
- Ensuring where necessary, care is increased closer to death (ibid).
There are a range of professionals involved in End-of-Life Care, who work collaboratively to provide the necessary support a patient needs, given this may vary from case to case. These professionals can include nurse specialists, counsellors, physiotherapists, dieticians, social workers, occupational therapists and doctors. They may be employed by a range of agencies including voluntary sector (e.g., Macmillan Cancer Support), Local Authority Adult Social Care and NHS organisations within hospital trusts and community-level providers. End of Life Care can range from a patient permanently moving to a care home for around the clock support and care, regular visits by social workers to their place of residence or making plans to die in their own home, surrounded by loved ones.
Palliative Care is defined by Marie Curie, the UK’s leading charity that provides support to people with terminal illness as the “treatment, care and support for people with a life-limiting illness and their family and friends”. Life-limiting illnesses are those that are incurable and likely to cause death. Dementia and advanced cancer are examples of these illnesses (ibid). In some instances, there is no movement between the two definitions, particularly around emotional support with coping with a diagnosis. Palliative Care is therefore related to terminal illness diagnoses, rather than the fact death is forthcoming.
8.3 National Policy Context for End-of-Life Care
There has been no national End of Life Care strategy or policy produced since the publication of the End-of-Life Care Strategy by the Department of Health in 2008 98. Since then, two key quality standards have been published by the National Institute of Health and Care Excellence (NICE), including QS13: End of Life Care for Adults 99 and QS144 Care of Dying Adults in the Last Days of Life 100 that support providers and commissioners to improve the quality of End-of-Life Care. They provide guidance on identifying gaps and areas of improvement, measuring quality of care, understanding how to improve care, demonstrating quality care is being provided and commissioning high-quality services.
In recent years, the national policy focus has been on the importance of facilitating patient choice and providing a person-centred approach. Enabling individuals to achieve their preferred place of death and ensuring equity of access have also been vital elements of these developments.
In 2015, an independent review was undertaken by The Choice in End-of-Life Care Programme Board 101, which highlighted that around 5% of End-of-Life Care patients would have complex needs, requiring specialist input and 30% would require a targeted offer, the remainder would be supported by universal provision. Targeted support could include patients with repeat hospital admissions (many of which are within 90 days of their death).
This review supported the development of a national framework for NHS England, which moved from a population health perspective towards a more individualistic approach to enable patients to move freely between categories as their care needs changed. NHS England published The End-of-Life Care Programme 102, which includes guidance and also provides the Comprehensive Personalised Care Model, with 6 evidence-based components, that aims to involve patients at all stages, in ways which meet their individual needs:
- Shared decision making
- Personalised care and support planning
- Enabling choice, including legal rights to choose
- Social prescribing and community-based support
- Patient activation and supported self-management
- Personal health budgets and integrated personal budgets 103.
At the start of 2019, The NHS Long Term Plan 104 was issued by NHS England, outlining the needs for the NHS operate in a cost-efficient and targeted manner, fit for modern society, including investments in technological developments and greater joined-up working to support this. In the context of End-of-Life Care, this document specified a need for differentiated support, providing personalised budgets for individuals to act as purchasers for their care and training for clinicians and social care staff to support these shifts proactively, to improve outcomes for End-of-Life Care patients. It listed reducing emergency admissions and enabling more people to choose where they die as its prime outcomes. It also outlined an opportunity of match-funding proposals for CCGs to support the increase in funding available for Children’s Hospices.
Whilst there continues to be no formalised strategic national guidance or official expectations for local areas to implement End of Life Care strategies, the most effective driver for local areas remains the outcomes of the local JSNA alongside the focus of the NHS Long Term Plan (ibid).
8.4 Local Policy Context for End-of-Life Care
There is currently no Wandsworth End of Life Care Strategy, although there have been plans to undertake this exercise, to provide strategic approach to delivery of this work, delays have likely been born out of the pandemic. There is a recently established End of Life Care Programme for South West London Health and Care Partnership, following the creation of this 6-Borough alliance in April 2020. The emergency of the COVID-19 pandemic has delayed some developments of this work.
8.5 Prioritising End of Life Care in Wandsworth
As Wandsworth’s thriving population both grows and ages, the number of people aged 65 or over is projected to increase by 44% across 20 years (from 29,300 in 2015 to 42,200 in 2035) 105. As a result, there will be a growing pressure on services for older people and those with terminal diagnoses across the life course. This is likely to particularly affect those services supporting the frailer and older population as they approach the end of their lives. This increasing population of older people is also likely to increase the prevalence of dementia and multimorbidity, potentially straining the local health and social care economy. Wandsworth has relatively high levels of recurrent emergency hospital admissions for patients in the last 90 days of life.
End of Life Care also has a role to play in managing resources and supporting people’s quality of life in their last days. Having an effective strategy and ensuring it is widely used, could provide unnecessary hospital deaths and increasing the percentage of residents in south-west London who die in their care home (rather than in hospital) by 1% would lead to savings of approximately £65,000 per year 106, saving money and also supporting people to ‘die better’.
Factors Impacting on End-of-Life Care
In 2017, 1,543 people died in Wandsworth, of these 753 were male and 790 were female with 63.1% aged 75 or older at the time of their death. Life expectancy at birth in 2017 in the Borough is 80.2 years for men and 83.6 years for women, this is higher than England’s averages. The Wandsworth resident can expect 15 years of deteriorating health in old age. Life expectancy varies geographically across the Borough, with women living 4.3 years lower than the average and men 5.6 years in the most deprived areas than the least deprived areas 107. The biggest causes of death making the largest contribution to gaps in life expectancy are circulatory disease, cancer and respiratory disease.
Social factors can affect a person’s wishes as well as their individual experiences (and that of their family and friends) at the end of their life, such as their ethnic background, language barriers and religion. These factors can impact on the quality and provision of services and as Wandsworth has a diverse population with hundreds of languages and cultures, need to be considered in local planning and policy in End-of-Life Care.
For more details about the Wandsworth demography, please see the People chapter.
8.6 Tackling Inequalities in End-of-Life Care
In 2015, Marie Curie commissioned an Independent Review covering literature and national data which solidified some policy makers, commissioners, care givers and clinicians concerns around fairness of accessibility and options in End-of-Life Care nationally. The review highlighted the inequities in palliative care across services, ethnic groups, ages, diagnoses and locations. The review also highlighted that any additional costs to improving reach of palliative care to those underserved, were likely to be “offset by savings associated with reduced need for acute care and fewer hospital death” 108.
The Care Quality Commission (CQC) has also explored inequalities in provision, through analysis of numerous data sources including from commissioners and staff. Further factors were found to be influential in the types of End-of-Life Care received, in addition to those outlined above, the CQC revealed background, sexual orientation, gender identity, disability and social circumstance were also factors impacting on the End-of-Life Care received. The CQC identified 10 groups of adults who often received inequitable End of Life Care, most of whom are covered by The Equality Act (2010) 109:
- People with conditions other than cancer
- Older people
- People with dementia
- People from BAME groups
- LGBT people
- People with a learning disability
- People with a mental health condition
- People who are homeless
- People who are in secure or detained setting
- Gypsy and Travelling Communities.
As a result of the above, the CQC requested that commissioners to improve access to End-of-Life Care 110, noting that this is a vital need nationally, given the volume of people within the general population who will fit into at least one of these categories. People living in Wandsworth who feature in one or more of these groups are therefore more likely to be at risk of inequitable End of Life Care provision. Wandsworth CCG chose to focus on the first 8 categories for a local strategy. The needs of those in secure or detained settings both have complex needs and those residing in Wandsworth Prison fall into the responsibility of St George’s Hospital and gypsy and travelling communities are the responsibility of NHS-England. Wandsworth CCG were keen to focus on people from BME groups and those who are homeless as both are disproportionately large within the local population by comparison to the England average and targeting work towards this group is expected to have profound impacts on outcomes.
The 2015, the National Survey of Bereaved People (VOICES) noted some significant discrepancies:
- Overall quality of care for females was rated significantly higher than males, with 44% of female respondents rating the care as outstanding or excellent compared with 39% for males
- 7 out of 10 people (69%) rated hospital care as outstanding, excellent or good which is significantly lower compared with care homes (82%), hospice care (79%) or care at home (79%)
- Ratings of fair or poor quality of care are significantly higher for those living in the most deprived areas (29%) compared with the least deprived areas (22%) 111.
Similarly, the CQC has also found that while 90% of hospices inspected are rated as outstanding, hospital care is less equitable with 42% of End-of-Life Care Services in acute hospitals considered inadequate and require improvements. This finding is supported by MacMillan’ 112 highlights that deprivation increases an individual’s risk of emergency admissions and dying in hospital.
8.7 Factors Influencing the Population Need for End-of-Life Care
Place of Death
The indicator, place of death, for Wandsworth residents varies compared to England’s averages. Significantly fewer residents in Wandsworth died at home compared the English average (19.84% compared to 22.83%) and significantly fewer people of all ages died in a care home compared to England’s average (19.3% compared to 22.5%) 113.
Percentage of deaths that occur in care homes: In 2022, Wandsworth’s rate was 28.8% (n=158), which was the 4th highest in London, 16.8% lower than the England average and 20.7% higher than the London average. The latest Borough figure for 2022 was also 3.7% lower than in 2013, in comparison with 5.8% decrease in England’s rate in the equivalent time period.
Source: OHID: Public Health Profiles
Source: OHID: Public Health Profiles
Percentage of deaths that occur at home: In 2022, Wandsworth’s rate was 24.8% (n=136), which was the 13th lowest in London, 10.1% higher than the England average and 3.9% lower than the London average. The latest Borough figure for 2022 was also 34.7% higher than in 2013, in comparison with 52.5% increase in England’s rate in the equivalent time period.
Source: OHID: Public Health Profiles
Source: OHID: Public Health Profiles
Despite the rising trend in percentage of people dying in their usual residence (either their home or their care home), still more Wandsworth’s residents die in hospitals.
Source: OHID: Public Health Profiles
However, the proportion of deaths at the usual residence (home or care home) is higher than the percentage of deaths in hospitals among people aged 85 and over (the figure below).
Hospital Admissions at the End of Life
Patients often find emergency hospital admissions to be disruptive and distressing, this is similar for their friends and family. NICE recommends the first stage of advanced care planning to identify options within the community.
Wandsworth has the highest ratio of ambulance call outs in care homes across South West London for residents in care homes, with 1.06:1 compared to 0.92:1 respectively. This could be related to quality of care within care homes although when looking at the admissions lasting more than one day, this is similar to the London average (30.5% compared to 29.9%) 114.
National Demographic Shifts
The ageing population and the rise of chronic illness amongst the local and general population are likely to increase the need for end-of-life care. A recent study looked at the mortality statistics for England and Wales from 2006–2014. It suggests that if the age and sex specific mortality rates remained the same as in 2011, the number of people requiring End of Life Care nationally would grow by 25% by 2040, and with the upward trend observed nationally between 2006–2014 this could be in excess of 40% (42.4% by 2040) 115.
Permanent Admissions to Residential and Nursing Care Homes
Permanent admissions to residential and nursing care homes per 100,000 aged 65+: In 2021/22, Wandsworth’s rate was 509.4 per 100,000 (n=163), which was the 8th highest in London, 5.4% lower than the England average and 27.0% higher than the London average. The latest Borough figure for 2021/22 was also 31.6% lower than in 2006/07, in comparison with 32.6% decrease in England’s rate in the equivalent time period.
Source: OHID: Public Health Profiles
Source: OHID: Public Health Profiles
Care Home and Nursing Care Beds Capacity
The shift in social care policy towards providing care at home, rather than in residential care, may explain some of the fall in bed availability. The number of people admitted to residential and nursing care homes has declined in recent years. However, there is no reliable data on the number of people receiving care at home, so it is difficult to measure changes in service provision.
The decrease in bed availability across London and England could also indicate a significant fall in social care provision for older people, which comes at a time of expected growth in demand due to the ageing population. A downward trend in the registration of new care homes, combined with an upward trend in closures, has resulted in a net reduction of the number of beds available 116.
Care home beds per 100 people 75+: In 2021, Wandsworth’s rate was 10.5 per 100 (n=1503), which was the 3rd highest in London, 10.9% higher than the England average and 47.5% higher than the London average. The latest Borough figure for 2021 was also 3.4% higher than in 2011, in comparison with 12.4% decrease in England’s rate in the equivalent time period.
Source: OHID: Public Health Profiles
Source: OHID: Public Health Profiles
Nursing home beds per 100 people 75+: In 2021, Wandsworth’s rate was 7.8 per 100 (n=1114), which was the highest in London, 68.0% higher than the England average and 86.6% higher than the London average. The latest Borough figure for 2021 was also 9.9% higher than in 2011, in comparison with 7.4% decrease in England’s rate in the equivalent time period.
Source: OHID: Public Health Profiles
Source: OHID: Public Health Profiles
8.8 Services Available for End-of-Life Care
Wandsworth has a range of service providers offering End of Life Care to residents in their last 12-months of life. They range from district nurses, who have specialist equipment on offer to support people at home, to bereavement services.
These services include 117:
- Residential and nursing homes in Wandsworth, providing specific residential support on site (33)
- Medicines can be accessed out of hours from many of the 60 community pharmacies open in the Borough
- St George’s University Hospitals NHS Foundation Trust based in Tooting provides a number of community services for older people and patients with terminal illnesses. Nearby Chelsea and Westminster and Kingston Hospitals are also used by Wandsworth residents
- GP surgeries for medication, support and advice, referral and bereavement support (42)
- A thriving voluntary and community sector working in partnership with the Council and CCG to deliver key services, with 35% of adult residents involved in volunteering. Specific organisations working in End-of-Life Care include Marie Curie, the Carers Centre and Shooting Stars who provide children’s palliative care
- Social prescribing offer
- Royal Trinity Hospice and its coordination centre provide palliative care via a team of community.
8.9 Determining the Unmet Need for End-of-Life Care
Choice of Place of Death
75% of the country’s population would prefer to die at home, whilst only a third actually do 118. The preference for death at home is likely to be underestimated, as not all patients may have their wishes recorded appropriately on health and care data systems.
Ensuring that individuals die in their preferred place of death is a key national aim for good End of Life Care. Comparatively speaking, data from the bereaved family and friends, suggests that they felt hospital was the right place for them to die, with 74% of respondents stating this compared to 3% recognising their relative wanted to die in hospital 119. This concept is little understood; perhaps individuals are less aware of the practicalities of dying at home, perhaps family and friends are anxious about how they might manage this and feel hospital is more appropriate and supportive.
8.10 Specific Groups and End of Life Care Health Inequalities
Black, Asian and Minority Ethnic groups
A national survey showed that care for BAME groups in their last 3-months of life, compared to White British people, were:
- more or as likely to receive help at home
- less likely to rate overall care as outstanding or excellent, particularly among those who had spent time in a care home or hospice
- more likely to die in hospital than a care home.
National research indicates that the barriers to accessing care include misunderstandings about what End of Life Care is, a general mistrust of health and care staff (which may already be present within sub-communities), and a lack of cultural awareness by providers 121.
Some of these misunderstandings about care creates a perceived fear about meeting the needs of the patient, especially those with difficulties in communicating in English. The presumption that services cannot meet the cultural needs can often result in self-discharge or in some cases return to the country of origin.
The lack of language interpreters puts friends and family under pressure to translate how the patients are feeling, which poses additional issues around confidentiality and being able to explicitly name wishes. Expressing the desire for additional support could be an issue in some cultures where a patent may not feel comfortable expressing this to their family member to translate for them.
Experiences of spiritual and bereavement services are also mixed, with some families reporting lack of access to appropriate chaplaincy due to their faith background and others reporting no bereavement resources being available in their language.
People who are Homeless
Research has suggested that End of Life Care services are often not suitable for people who are homeless. For those who live in hostels, the environment is often inappropriate for providing such services in cramped, chaotic, noisy, less equipped to support the specific needs. Information sharing can become problematic as hostel staff may not be recognised as next of kin and they may require their own emotional support.
People who are homeless may have a greater number of comorbidities or dual diagnosis (substance misuse and mental health need), presenting a greater level of specialist need to which specialist services may not exist, and which may exclude the person from meeting the criteria for a residential care home. In addition, they could be younger than the typical age for referral into a residential care home 122.
Dementia
Quality care for people with dementia can be affected due to the important conversations about planning their end-of-life care not taking place early enough before a patient deteriorates and therefore has reduced capacity to express their wishes 123.
LGBTQ+ Community
Patients from the LGTBQ+ community have expressed their identity as a barrier to accessing End of Life Care services, and often report mixed previous experiences of health and social care, with some feeling that their preferences were assumed based on their sexual orientation, and others feeling excluded in communal establishments, which may be in part due to more prejudicial views of their peers whilst growing up.
Additionally, in some circumstances, the partners of homosexual patients were not as included as the heterosexual partners 124. As a result, patients from these communities may experience fear of disclosing their sexual orientation, and national studies have found that many care home residents choose not to reveal this with staff.
People with a Learning Disability
People with a learning disability have a lower life expectancy and are more likely to die prematurely or avoidably than the general population. This, coupled with the recognised challenge of identification of deterioration or dying in this population, often leads to late identification with limited opportunity to explore wishes and preferences and to involve family 6[Heslop P, Blair P, Fleming P, Hoghton M, Marriott A and Russ L, Confidential Inquiry into premature deaths of people with learning disabilities (CIPOLD), Final report, 2013.].
The CQC report on the experience of those with learning disabilities at the end of life identified the core themes of lack of awareness, communication challenges, and the importance of coordination of care as key themes for this population. Poor understanding of learning disabilities could result in misattribution of cause of symptoms and late diagnosis of illness, impacting on the success of treatment. Additionally, early and continuous involvement of staff who knew the individual and use of a care coordinator were thought to be of value in ensuring high quality and coordinated care. Therefore, training and support for early identification of those approaching the end of life in this population was recommended as a focus for commissioners and providers 125.
People with Mental Health Conditions
Mental health is a recognised cause of premature death, in part because people with mental health conditions may have physical needs overlooked and symptoms may be misattributed. Mental health disorders can reduce individual’s motivation and ability to engage in health lifestyle behaviours. As a result, people with serious mental illnesses (excluding dementia) die on average 20 years earlier than the rest of the population. As with those who are homeless or have a learning disability, this early onset of end-of-life care needs is often missed, leading to late identification resulting in patients not having enough time to plan their End-of-Life Care appropriately 126.
In Wandsworth, an estimated 48,500 adults have a common mental health problem, which equates to one in five adults. Nationally, women are more likely than men to experience mental illness and in Wandsworth 15% of men (18,000) and 23% of women (30,500) have a mental health condition. There are overlaps with vulnerability factors such as sexual orientation, deprivation, and homelessness. Mental health conditions also disproportionately affect people from BAME groups; they are more than twice as likely to experience psychosis and commit suicide. In Wandsworth nearly 40% of the people using hospital mental health services are from BAME groups, although, they only comprise around 25% of the population of Wandsworth 127.
Children and Young People
While child deaths are relatively less common, approximately 2,500 children die annually, as a result of a life-limiting or life-threatening condition, and there are estimated to be 49,000 children and young people under 18 years old living with a life-limiting or life-threatening condition in the UK.
These numbers are expected to rise due to medical advances in testing, screening and recognition of signs and symptoms, and increasing life expectancy.
Additionally, an epidemiological study from 2010 found that London had the highest prevalence of children living with life-limiting conditions of any region in England. The 2011 Census recorded 1,551 children and young people up to 15 years old, with a long-term health problem or disability that in some way limited their day-to-day activities, representing 3% of Wandsworth’s children population, compared to 3.4% in London . Children and young people with life-limiting conditions are more likely to need palliative care, specialist services long before their death 128.
8.11 Evidence Based Interventions
The UK policy makers are currently heavily focussed on a number of key strands of End-of-Life Care; namely, to ensure provision of care is appropriate and taking individual differences into account both have a positive impact on a patient’s quality of life in their last years, months and days of life.
In 2016, the National Palliative and End of Life Care Partnership published a national framework for action, with 6 key ambitions to support people in their last months 129. These are outlined in (the figure below) and reflect an increased focus on empowering and enabling local communities to contribute to End-of-Life Care services and seeing each person as an individual.

Source: Ambitions for Palliative & End of Life Care ’A national framework for local action 2015–2020
The figure clearly shows the expectations of high quality and appropriate End of Life Care, to meet the needs of all patients in their last years, months and days of life.
Firstly, that each person needs to be seen as an individual, which marks a stark change to focusing on planning population-wide interventions of previous decades. Each person has a completely different life experience, and as such, is highly likely to have a different experience of dying and death.
Considering the cultural context, including language and specific social and religious practices in advance and not just at the time of death and in the bereavement stages is very important. Communicating in a manner to which is understood by the patient, their friends and family is vital. This would apply for all vulnerable groups, particularly those from BAME and LGBQTI group, given the cultural and identity components which when excluded can have a huge detrimental impact on quality of life in its final stages.
Secondly, all patients need to be provided with access to care; it is interesting to note that those who are more affluent often receive better quality of care.
Thirdly, wellbeing and comfort are addressed as core elements of care, involving reduction in distress in order for the end of life to be as comfortable for patients as possible.
Fourthly, coordination of care, including data sharing and communication between medical, social and voluntary sector staff alongside the friends and family of the patient is critical. This would reduce any gaps or duplication in gathering information and increase the likelihood of a person’s wishes regarding where and how they die to be widely known and honoured.
Fifthly, all staff involved in End of Life Care are fully competent, ensuring they are equipped with the necessary personal skills enabling then to provide compassionate.
Finally, that communities should be involved in the support and care, that people are confident in having conversations about dying and death and practical support is provided.
Bibliography and Sources
Dementia
Department of Health and Social Care (2019) Dementia 2020 Challenge: 2018 Review Phase 1 URL: https://assets.publishing.service.gov.uk/government/uploads/system/uploads/attachment_data/file/780777/dementia-2020-challenge-2018-review.pdf).
House of Commons (2017) Dementia: policy, services and statistics BRIEFING PAPER Number 07007, 21 June 2019
National Collaborating Centre for Mental Health. The Dementia Care Pathway. Full implementation guidance. London: National Collaborating Centre for Mental Health; 2018.
NHS England. Dementia Implementation Guide.
NICE Clinical Knowledge Summary: Dementia (August 2016).
NICE Pathway: Dementia Overview–updated 31 March 2020.
NICE Quick Guides - (2018) Dementia–discussing and planning support after diagnosis - A quick guide for people with Dementia and their family and carers.
PHE (2013) Improving Health and Lives. (2013). Making Reasonable Adjustments to Dementia Services for People with Learning Disabilities: Public Health England.
WHO–(2018) Risk reduction of cognitive decline and Dementia, WHO Guideline Essentials.
End of Life Care
Pan, P. (2019). Never Old. London: Penguin. Retrieved April 15, 2020.
Pham Trah My, P. I. (2018). Trends in Dementia diagnosis rates in UK ethnic groups: analysis of UK primary care data. Clinical Epidemiology. 2018, Aug 8;10:949-960. doi: 10.2147/CLEP.S152647. eCollection.
Public Health England (PHE). (2019, December 16). Guidance: Sexual and reproductive health and HIV: applying All Our Health. URL: https://www.gov.uk/government/publications/sexual-and-reproductive-health-and-hiv-applying-all-our-health/sexual-and-reproductive-health-and-hiv-applying-all-our-health.
Public Health England, (PHE). (2014). (Public Health England) URL: https://assets.publishing.service.gov.uk/government/uploads/system/uploads/attachment_data/file/373105/NCSP_achieving_DR.pdf.
The Kings Fund. (n.d.). URL: https://www.kingsfund.org.uk/publications/what-are-health-inequalities#what
Global Burden of Disease, 2019↩︎
Jaul E and Barron J, Age-Related Diseases and Clinical and Public Health Implications for the 85 Years Olds and Over Population, Front Public Health, Vol. 5, 2017. URL: https://www.frontiersin.org/journals/public-health/articles/10.3389/fpubh.2017.00335/full.↩︎
Webber S et al., Mobility in Older Adults: A Comprehensive Framework, The Gerontologist, Vol.50, No.4, 2010. URL: https://academic.oup.com/gerontologist/article/50/4/443/743504↩︎
Mobility, Projecting Older People Population Information System, 2018. URL: https://www.poppi.org.uk/index.php?pageNo=342&sc=1&loc=8640&np=1).↩︎
Frailty: what’s it all about?, British Geriatrics Society, 2018. URL: https://www.bgs.org.uk/resources/frailty-what%E2%80%99s-it-all-about↩︎
Steptoe A et al., Cohort Profile: The English Longitudinal Study of Ageing’, International Journal of Epidemiology, Vol.42, No.6, 2013. URL: https://academic.oup.com/ije/article/42/6/1640/735886↩︎
URL: https://www.gov.uk/government/publications/falls-applying-all-our-health/falls-applying-all-our-health↩︎
URL: https://www.gov.uk/government/publications/falls-applying-all-our-health/falls-applying-all-our-health↩︎
URL: https://www.england.nhs.uk/south/wp-content/uploads/sites/6/2017/03/falls-fracture.pdf↩︎
National Hip Fracture Database (NHFD), National Hip Fracture Database. National report 2013. URL: https://www.nhfd.co.uk/20/hipfractureR.nsf/luMenuDefinitions/CA920122A244F2ED802579C900553993/$file/NHFD%20Report%202013.pdf?OpenElement)↩︎
NICE (2013) Falls in older people: assessing risk and prevention Clinical guideline (CG161). URL: https://www.nice.org.uk/guidance/cg161/chapter/Introduction)↩︎
NICE (2013) Falls in older people: assessing risk and prevention Clinical guideline (CG161). URL: https://www.nice.org.uk/guidance/cg161/chapter/Introduction↩︎
Public Health England (2017) Falls and fracture consensus statement: resource pack, PHE. URL: https://assets.publishing.service.gov.uk/government/uploads/system/uploads/attachment_data/file/628732/Falls_and_fracture_consensus_statement_resource_pack.pdf↩︎
URL: https://www.ageuk.org.uk/documents/en-gb/campaigns/stop_falling_report_web.pdf?dtrk=true↩︎
URL: https://assets.publishing.service.gov.uk/government/uploads/system/uploads/attachment_data/file/679885/Structured_literature_review_report_falls_prevention.pdf)↩︎
URL: https://assets.publishing.service.gov.uk/government/uploads/system/uploads/attachment_data/file/679856/A_return_on_investment_tool_for_falls_prevention_programmes.pdf)↩︎
Wandsworth Age UK, 2020.↩︎
Department of Health & Social Care. Adult social care outcomes framework (ASCOF). 2023. URL: https://www.gov.uk/government/publications/adult-social-care-outcomes-framework-handbook-of-definitions/adult-social-care-outcomes-framework-2023-to-2024-draft-handbook-of-definitions)↩︎
Dementia UK↩︎
Rarer causes of Dementia, Factsheet 442LP March 2015.↩︎
Causes of Dementia-Dementia guide. URL: https://www.nhs.uk/↩︎
Causes of Dementia-Dementia guide. URL: https://www.nhs.uk/)↩︎
Deaths registered in England and Wales - Office for National Statistics.↩︎
Dementia: applying All Our Health. GOV.UK.↩︎
PHE Dementia Co-morbidities in patient’s data briefing, 2019↩︎
Department of Health % Social Care (2013) Dementia A state of the nation report on Dementia care and support in England. Available at Dementia - A state of the nation report on Dementia care and support in England (publishing.service.gov.uk)↩︎
Worst Hit: Dementia During Coronavirus (September 2020)↩︎
Department of Health & Social Care (2015) Prime Minister’s challenge on Dementia 2020. URL: https://www.gov.uk/government/publications/prime-ministers-challenge-on-dementia-2020/prime-ministers-challenge-on-dementia-2020↩︎
The National Dementia Strategy, ‘Living Well with Dementia’ (Department of Health, 2009)↩︎
NHS England, Five Year Forward View, October 2014↩︎
NHS England, New Models of Care Programme, January 2015↩︎
NHS England Next Steps on the NHS Five Year Forward View, March 2017↩︎
Department for Health Dementia (2013). A state of the nation report on Dementia care and support in England↩︎
Care Quality Commission, Cracks in the Pathway (2014)↩︎
NICE Dementia (QS184). Published June 2019.↩︎
Dementia: assessment, management and support for people living with Dementia and their carers NICE guideline Published: 20 June 2018. URL: www.nice.org.uk/guidance/ng97)↩︎
Dementia, disability and frailty in later life–mid-life approaches to delay or prevent onset NICE guideline (NG16). URL: https://www.nice.org.uk/guidance/ng16↩︎
Knapp M, Comas-Herrera A, Wittenberg R, Hu B, King D, Rehill A, et al. Scenarios of Dementia care: what are the impacts on cost and quality of life? URL: http://www.pssru.ac.uk/↩︎
PHE (2016) Public Health England Guidance: Health matters: midlife approaches to reduce Dementia risk, 2016↩︎
Alzheimer’s Society. Risk factors for Dementia↩︎
PHE British Social Attitudes to Dementia Findings from the 2015 British Social Attitudes survey↩︎
Alzheimer’s Society. Risk factors for Dementia↩︎
Pham Trah My, Petersen I, Walters K, Raine R, Manthorpe J, Mukadam N, Cooper C. Trends in Dementia diagnosis rates in UK ethnic groups: analysis of UK primary care data. Clinical Epidemiology. 2018↩︎
Primary Care Mortality Database↩︎
URL: https://www.alzheimers.org.uk/about-Dementia/types-Dementia/learning-disabilities-Dementia?documentID=103)↩︎
Baumgart M., Snyder H. M., Carrillo M. C., Fazio S., Kim H., Johns H. (2015). Summary of the evidence on modifiable risk factors for cognitive decline and Dementia: a population-based perspective. Alzheimer’s Dement. 11, 718–726.↩︎
Farrell, L et all (2014). The socioeconomic gradient in physical inactivity: Evidence from one million adults in England, in Social Science & Medicine Volume 123, December 2014, Pages 55-63↩︎
PHE Strategy 2020-25, Public Health England (2019)↩︎
Lewis F, Schaffer S, Sussex J, O’Neill P, Cockcroft L. The Trajectory of Dementia in the UK–making a Difference. 2014↩︎
WHO Risk reduction of cognitive decline and Dementia: WHO guidelines, 2019↩︎
DH (2011) Living well with Dementia: A National Dementia Strategy Good Practice Compendium - an assets approach↩︎
From diagnosis to end of life: The lived experiences of Dementia care and support.↩︎
Dementia, disability, and frailty in later life–mid-life approaches to delay or prevent onset. NICE guideline (NG16). URL: https://www.nice.org.uk/guidance/ng16)↩︎
Alzheimer’s Society. (2018) Tacking Loneliness in People Living with Dementia.↩︎
Livingston G, Sommerlad A, Orgeta V, Costafreda SG, Huntley J, Ames D, et al. Dementia prevention, intervention, and care. The Lancet 2017;390(10113):2673–734.↩︎
Ray, S and Davidson, S (2014) Dementia and cognitive decline. A review of the evidence. AGE UK Research↩︎
Department of Health and Social Care. After diagnosis of Dementia: what to expect from health and care services↩︎
Multimorbidity: clinical assessment and management. NICE guideline [NG56] Published date: 21 September 2016↩︎
Older people with social care needs and multiple long-term conditions. NICE guideline (NG22) Published date: 04 November 2015↩︎
NHS England. Dementia: Good Care Planning. 2017↩︎
Dementia Quality standard [QS184] Published date: 28 June 2019↩︎
Managing medicines for adults receiving social care in the community. NICE guideline (NG67) Published date: 30 March 2017↩︎
Building Dementia Friendly Communities–a Priority for Everyone – Alzheimer’s Society 2013↩︎
Dementia friendly communities. Guidance for councils, LGA and Innovations in Dementia (2015).↩︎
Is your care home Dementia friendly? EHE Environmental Assessment Tool.↩︎
SWL-care-home-data-pack-2019.pdf (england.nhs.uk)↩︎
Dementia Cafes - Halley, E., Boulton, R., McFadzean, D., & Moriarty, J. (2005). The Poppy Cafe: A multiagency approach to developing an Alzheimer cafe. Dementia: The International Journal of Social Research and Practice, 4(4), 592-594↩︎
Ienca M, Fabrice J, Elger B, et al. (2017). Intelligent assistive technology for Alzheimer’s disease and other Dementias: a systematic review. Journal of Alzheimer’s Disease 56(4) 1301-1340. [PubMed abstract]↩︎
Fleming, R., & Sum, S. (2014). Empirical studies on the effectiveness of assistive technology in the care of people with Dementia: a systematic review. Journal of Assistive Technologies, 8(1), 14-34.↩︎
Supporting adult carers. NICE guideline (NG150) Published date: 22 January 2020↩︎
My life until the end. Dying well with Dementia, Alzheimer’s Society, 2012.↩︎
End of life care for adults. Quality standard [QS13] Published date: 28 November 2011 Last updated: 07 March 2017↩︎
Care of dying adults in the last days of life. Quality standard [QS144] Published date: 02 March 2017↩︎
Alzheimer’s’ Society Dementia Attitudes Monitor Wave 1, 2018↩︎
Public attitudes towards Dementia, Alzheimer’s Research UK and Dementia Statistics Hub. URL: https://www.Dementiastatistics.org/attitudes/)↩︎
Dementia Health Needs Assessment–Prevention and Care (2019); Available at: DataWand↩︎
URL: https://digital.nhs.uk/data-and-information/publications/statistical/recorded-dementia-diagnoses/september-2020↩︎
Lewis et al. Office of Health Economics and Alzheimer’s Research UK.↩︎
Wandsworth Local Authority. Mosaic Adult Social Care Database. 2019↩︎
King’s College London, and London School of Economics, Prince Knapp. Dementia UK: Second Edition. URL: https://eprints.lse.ac.uk/59437/↩︎
SWL Care Home Data Pack (england.nhs.uk).↩︎
Dementia: assessment, management and support for people living with Dementia and their carers. Guidance. NICE. URL: https://www.nice.org.uk/guidance/ng97↩︎
Recorded Dementia Diagnoses. URL: https://digital.nhs.uk/data-and-information/publications/statistical/recorded-dementia-diagnoses↩︎
Non-Dementia Pathways Guidance from the London Dementia Clinical Networks, January 2020.↩︎
King’s College London, and London School of Economics, Prince Knapp. Dementia UK: Second Edition. URL: https://eprints.lse.ac.uk/59437/↩︎
Primary Care Network (PCN)↩︎
SWL Care Home Data Pack (england.nhs.uk). URL: https://www.england.nhs.uk/london/wp-content/uploads/sites/8/2020/03/SWL-care-home-data-pack-2019.pdf↩︎
Public Health England (2019) Atlas of Variation for Palliative and End of Life Care. URL: http://tools.england.nhs.uk/images/EOLCatlas/atlas.html↩︎
College of Policing Limited (2019) [Internet]. Practice Advice: Dealing with sudden unexpected death. URL: https://assets.publishing.service.gov.uk/government/uploads/system/uploads/attachment_data/file/922344/Dealing_with_sudden_unexpected_death.pdf↩︎
Marie Curie (2018) [Internet]. What are palliative care and end of life care? URL: https://www.mariecurie.org.uk/help/support/diagnosed/recent-diagnosis/palliative-care-end-of-life-care↩︎
General Medical Council (GMC) (2010) [Internet]. Treatment and Care towards the end of life: good practice in decision-making. URL: https://www.gmc-uk.org/-/media/documents/treatment-and-care-towards-the-end-of-life---english-1015_pdf-48902105.pdf?la=en&hash=41EF651C76FDBEC141FB674C08261661BDEFD004)↩︎
Department of Health (DoH) (2008). End of Life Care Strategy: Promoting High Quality Care for All Adults at End of Life. URL: https://assets.publishing.service.gov.uk/government/uploads/system/uploads/attachment_data/file/136431/End_of_life_strategy.pdf↩︎
NICE (2011) End of Life Care for Adults Quality Standard QS13. URL: https://www.nice.org.uk/guidance/qs13↩︎
NICE (2017) Care of Dying Adults in the Last Days of LIFE Quality Standard QS144. URL: https://www.nice.org.uk/guidance/QS144↩︎
The Choice in End-of-Life Care Programme Board (2015) [Internet]. What’s Important to Me. A Review of Choice in End-of-Life Care. URL: https://www.gov.uk/government/publications/choice-in-end-of-life-care↩︎
NHS England (undated) End of Life Care. URL: https://www.england.nhs.uk/eolc/↩︎
NHS England. Personalised End of Life Care. URL: https://www.england.nhs.uk/eolc/personalised-care/↩︎
NHS England (2019). The NHS Long Term Plan. URL: https://www.longtermplan.nhs.uk/publication/nhs-long-term-plan/↩︎
Wandsworth Council (2019) JSNA and Annual Report 2017-2018. URL: https://www.datawand.info/wp-content/uploads/2018/05/Wandsworth-JSNA-Annual-Summary-2017-18-Final.pdf↩︎
South West London Sustainability and Transformation Partnership (STP) (2018) South West London STP Care Home Data Pack. URL: https://www.england.nhs.uk/london/wp-content/uploads/sites/8/2020/03/SWL-care-home-data-pack-2019.pdf↩︎
Wandsworth Council. Health and Social Care. URL: https://www.datawand.info↩︎
Personal Social Services Research Unit London School of Economics and Political Science (2015) Equity in the Provision of Palliative Care in the UK: Review of Evidence. URL: https://www.mariecurie.org.uk/globalassets/media/documents/policy/campaigns/equity-palliative-care-uk-report-full-lse.pdf↩︎
Equality Act (2010). URL: https://www.legislation.gov.uk/ukpga/2010/15/contents↩︎
The Care Quality Commission (2016) A different ending: End of Life Care Review. URL: https://www.cqc.org.uk/publications/themed-work/different-ending-end-life-care-review↩︎
Office of National Statistics (ONS) (2015) National Survey of Bereaved People (VOICES): England. URL: https://www.ons.gov.uk/peoplepopulationandcommunity/healthandsocialcare/healthcaresystem/bulletins/nationalsurveyofbereavedpeoplevoices/england2015↩︎
Macmillan Cancer Support (2017) The Final Injustice: Variation in End-of-Life Care in England. URL: https://www.macmillan.org.uk/_images/MAC16904-end-of-life-policy-report_tcm9-321025.pdf↩︎
Public Health England (2019) Atlas of Variation for Palliative and End of Life Care. URL: http://tools.england.nhs.uk/images/EOLCatlas/atlas.html↩︎
South West London STP. South West London STP Care Home Data Pack↩︎
Etkind, Bone et al (2017). ’How many people will need palliative care in 2040? Past trends, future projections, and implications for services. BMC Medicine 2017. 15:102. URL: https://doi.org/10.1186/s12916-017-0860-2↩︎
Nuffield Trust: Care home bed availability. 2021. URL: https://www.nuffieldtrust.org.uk/resource/care-home-bed-availability↩︎
Wandsworth Council. JSNA and Annual Report 2017-2018. URL: https://www.datawand.info/wp-content/uploads/2018/05/Wandsworth-JSNA-Annual-Summary-2017-18-Final.pdf↩︎
URL: https://www.nice.org.uk/guidance/ng142/evidence/c-barriers-to-accessing-end-of-life-care-services-pdf-6955526992↩︎
Voices Survey (as previously↩︎
South West London STP. South West London STP Care Home Data Pack, 2018. As previously↩︎
Dixon J, King D, Matosevic T, Clark M and Knapp M (2015) Equity in Palliative Care in the UK, PSSRU, London: London School of Economics/Marie Curie↩︎
St Mungo’s and Marie Curie Palliative Care Research Unit at University College London (2011) Supporting homeless people with advanced liver disease approaching the end of life.↩︎
People with Dementia. A different ending: Addressing Inequalities in End-of-Life Care. Care Quality Commission 2017. URL: https://www.cqc.org.uk/publications/themed-work/different-ending-end-life-care-review↩︎
Care Quality Commission (2017) Lesbian, Bisexual and Transgender People. A different ending: Addressing Inequalities in End-of-Life Care. URL: https://www.cqc.org.uk/publications/themed-work/different-ending-end-life-care-review↩︎
People with Disabilities. A different ending: Addressing Inequalities in End-of-Life Care. Care Quality Commission 2017. URL: https://www.cqc.org.uk/publications/themed-work/different-ending-end-life-care-review↩︎
Rethink Mental Illness, Lethal Discrimination, 2013.↩︎
Wandsworth Council (2015) Happy and thriving communities Annual report for the director of public health, 2015. URL: https://www.datawand.info/wp-content/uploads/2018/10/Public_Health_Annual_Report_2015.pdf↩︎
How many children and young people are affected by a life-limiting or life-threatening condition? Together for Short Lives. URL: https://www.togetherforshortlives.org.uk/resource/numbers-of-children-affected-by-life-limiting-or-threatening-conditions/↩︎
The National Palliative and End of Life Care Partnership. Ambitions for Palliative and End of Life Care: A national framework for local action 2015-2020. 2015. URL: http://endoflifecareambitions.org.uk/wp-content/uploads/2015/09/Ambitions-for-Palliative-and-End-of-Life-Care.pdf↩︎
5.2 Social Isolation
Social Isolation of Social Care Users aged 65+
There is a well-established link between loneliness and poor mental and physical health. Wandsworth’s proportion of adult social care users aged 65+ who have as much social contact as they would like is presented below.
Social Isolation: percentage of adult social care users who have as much social contact as they would like: In 2022/23, Wandsworth’s rate was 39.1% (n=610), which was the 5th highest in London, 5.8% lower than the England average and 9.5% higher than the London average. The latest Borough figure for 2022/23 was also 4.9% lower than in 2014/15, in comparison with 3.0% decrease in England’s rate in the equivalent time period.
Source: OHID: Public Health Profiles
Source: OHID: Public Health Profiles
Social Isolation of Adult Carers aged 65+
Social Isolation: percentage of adult carers who have as much social contact as they would like: In 2021/22, Wandsworth’s rate was 29.5% (n=20), which was the 16th highest in London, 2.4% higher than the England average and 6.5% higher than the London average. The latest Borough figure for 2021/22 was also 32.6% lower than in 2014/15, in comparison with 28.0% decrease in England’s rate in the equivalent time period.
Source: OHID: Public Health Profiles
Source: OHID: Public Health Profiles